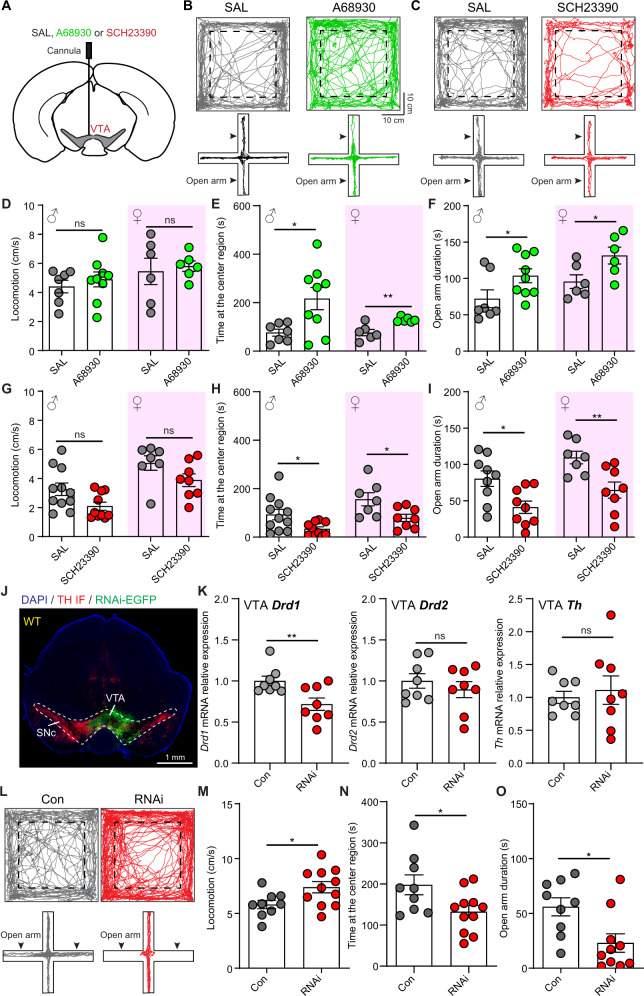
Fig. 1. Manipulating VTA D1 receptors bidirectionally regulates mouse anxiety-like behaviors.
A Schematic illustration of pharmacological experiment. D1 receptor agonist A68930, D1 receptor antagonist SCH23390, or saline (SAL) were unilaterally injected into the VTA. B Example trajectories of mice with SAL (Left) and A68930 (Right) treatment in open-field test (Top) and EPM test (Bottom). Dashed boxes indicate the center region. C Same as B, but for mice with SAL and SCH23390 microinjection. D Summary of mouse locomotor speed with microinjection of SAL and A68930 into the VTA. n = 7 male mice and 6 female mice for SAL groups, and 9 male mice and 6 female mice for A68930 groups, Unpaired t-test test. E and F Same as D, but for the time spent at the center region (E), and the time spent at the open arms in EPM test (F). *p < 0.05, **p < 0.01, Mann–Whitney test for male open arm duration in EPM test, and Unpaired t-test for other comparisons. G–I Same as D–F, but for microinjecting SAL and SCH23390 into the VTA. n = 11 male mice and 7 female mice for SAL groups, and 10 male mice and 8 female mice for SCH23390 groups in open-field test; n = 9 male mice and 7 female mice for SAL groups, and 9 male mice and 8 female mice for SCH23390 groups in EPM test, *p < 0.05, **p < 0.01, Mann–Whitney test for locomotion in open-field test, and Unpaired t-test for other comparisons. J An example image showing AAV9-U6-shRNA(Drd1)-EGFP virus expression in VTA. TH IF: red. K Relative VTA Drd1, Drd2, and Th mRNA expression in control mice (n = 8) and RNAi mice (n = 8). **p < 0.01, Unpaired t-test. L Example trajectories in open-field test (Top) and EPM test (Bottom) for one control (Con) mouse (Left) and one RNAi mouse (Right). M Locomotor speed of Con and RNAi mice. *p < 0.05, Unpaired t-test, n = 9 and 11 male mice for control and RNAi mice, respectively. N and O Same as M, but for the time spent at the center region in open-field test (N) and time spent at the open arms in EPM test (O).

