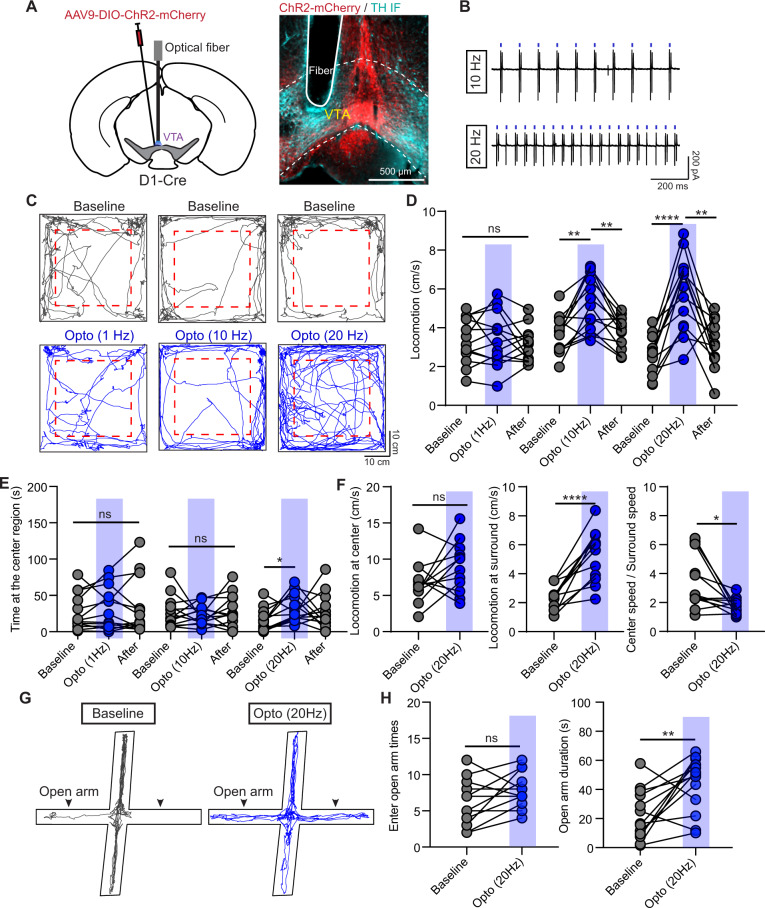
Fig. 3. Optogenetic activation of VTA D1 neurons relieves mouse anxiety-like behaviors.
A Left: Schematic of viral transduction strategy to express ChR2-mCherry in VTA D1 neurons. Right: an example image showing the ChR2-mCherry expression and the location of implanted optical fiber. ChR2-mCherry: red; TH IF: cyan. B Cell-attached recording traces of a VTA ChR2-mCherry+ neuron in response to 10-ms-long 470 nm light pulses at 10 Hz (Top) and 20 Hz (Bottom). C Trajectories of one mouse in open-field test before (Top) and during light stimulation (Bottom) with frequency at 1 Hz (Left), 10 Hz (Middle), and 20 Hz (Right). Dashed boxes indicate the center region. D Statistical results of locomotor speed before, during, and after 5-min light stimulation with frequency at 1 Hz, 10 Hz, and 20 Hz, respectively. One-way ANOVA with Tukey’s multiple comparisons post hoc test, n = 13 (9 male and 4 female) mice, **p < 0.01, ****p < 0.0001. E Same as D, but for time spent at the center region. *p < 0.05, One-way ANOVA with Tukey’s multiple comparisons post hoc test. F Statistical results of the locomotor speed at the center region (Left), locomotor speed at the surround region (middle), and ratio between locomotor speed at center and surround regions before and during light stimulation with frequency at 20 Hz. n = 12 (8 male and 4 female) mice, *p < 0.05, ****p < 0.0001, Paired t-test for the surround locomotion and Wilcoxon matched-pairs signed rank test for the ratio between center and surround speeds. G Trajectories of one mouse in EPM test without (Left) and with (Right) light stimulation at 20 Hz. H Statistical results of times entering the open arms (Left) and the duration staying at the open arms (Right) without and with light stimulation at 20 Hz, respectively. n = 13 mice, **p < 0.01, Paired t-test.

