Figure 1.
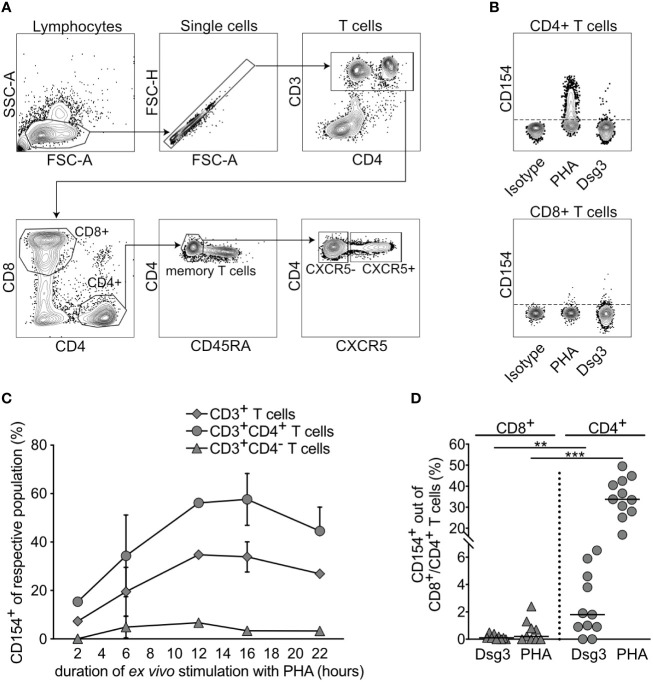
CD154 expression of CD3+ T cells and their subpopulations upon ex vivo stimulation. (A) Gating strategy to identify lymphocytes, single cells, T cells in peripheral blood, CD4+ and CD8+ T cells, memory T cells, CXCR5- and CXCR5+CD4+ T cells. FSC-A, forward scatter area; SSC-A, side scatter area; FSC-H, forward scatter height. (B) Representative flow cytometry plots portraying CD154 expression by CD4+ T cells upon antigenic (Dsg3) and mitogenic (PHA) ex vivo stimulation for 16 hours. (C) Kinetic analysis of relative CD154 frequency, identified by flow cytometry in peripheral blood, upon polyclonal stimulation out of respective parent population, i.e. CD3+ T cells, CD3+CD4+ T cells, CD3+CD4- T cells, CD3+CD4+CXCR5- T helper and CD3+CD4+CXCR5+T follicular helper cells, respectively. (n=1-3). (D) Relative frequency of CD154 expression on CD8+ and CD4+ T cells in peripheral blood of PV patients upon specific (Dsg3) or nonspecific (PHA) ex vivo stimulation for 16 hours (n=9-11). p<0.01 **, p<0.001 ***.

