Figure 2.
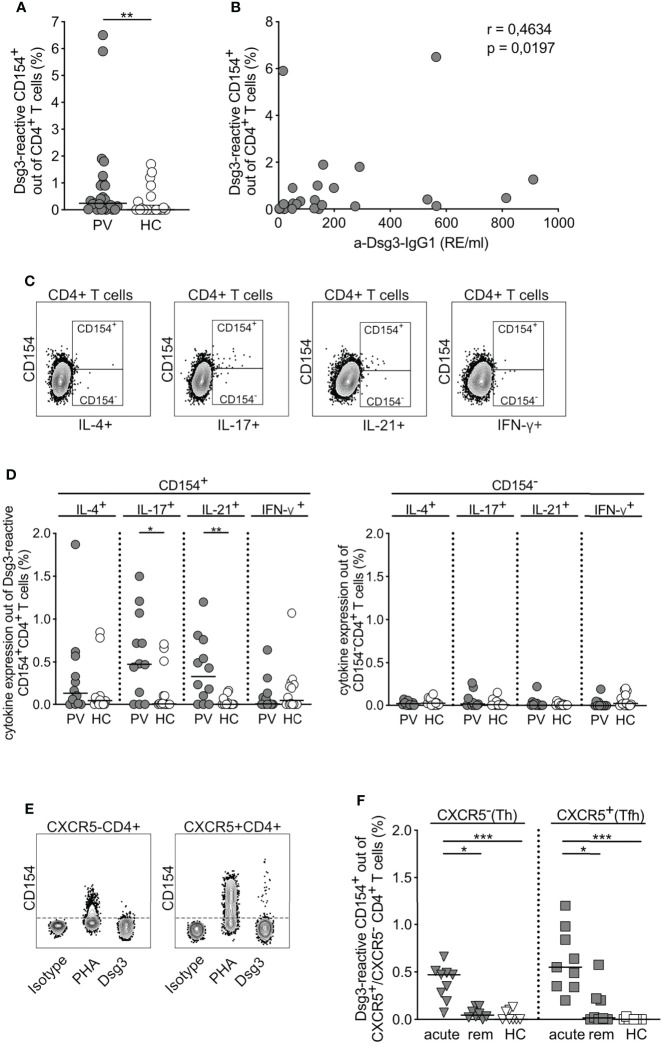
Characteristics of Dsg3-reactive CD154+ CD4+ T cells. (A) Relative frequency of CD154 expression upon ex vivo stimulation with Dsg3 in PV vs HC (PV n=25; HC n=22). (B) Correlation of anti-Dsg3-IgG1 serum concentration with relative frequencies of Dsg3-reactive CD154+CD4+ T cells in PV patients (n=25). Spearman’s rank correlation coefficient r=0.4634 and p=0.0197. (C) Representative flow cytometry plots depicting CD154- and CD154+ CD4+ T cells upon specific Dsg3 stimulation and their respective cytokine secretion of IL-4, IL-17, IL-21 and IFN-γ. (D) Relative frequency of IL-4, IL-17, IL-21 or IFN-γ cytokine expression in Dsg3-reactive CD154+CD4+ T cells on the left and CD154-CD4+ T cells (right; PV n=12; HC n=14). (E) Representative flow cytometry plots depicting CXCR5 expression in CD4+ T cells upon respective stimulation. (F) Relative frequencies of CD154 on CXCR5-CD4+ T (Th) cells and CXCR5+CD4+ T (Tfh) cells for acute PV, remittent PV patients and HC upon specific ex vivo stimulation with Dsg3 (acute PV, n=9; remittent PV, n=8; HC, n=8). (D) p<0.05 *, p<0.01 **, p<0.001 ***.

