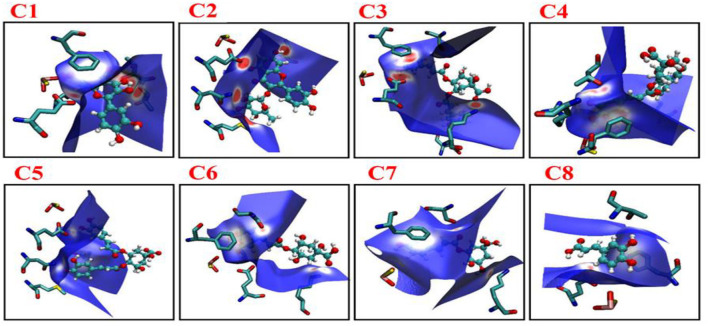
Figure 8.
Images showing the Hirshfeld surfaces that use color-coding to represent the proximity of close contacts around residues in phenolic compounds C1–C8 in different system (white, distance d equals the van der Waals distance; blue, d exceeds the van der Waals distance; red, d is less than van der Waals distance). C1, quercetin; C2, quercetin-3-rhamnoside; C3, 4,5-O-dicaffeoylquinic acid; C4, 3,5-O-dicaffeoylquinic acid; C5, 3,4-O-di-caffeoylquinic acid; C6, 4-O-caffeoylquinic acid; C7, 3-O-caffeoylquinic acid; and C8, caffeic acid.

