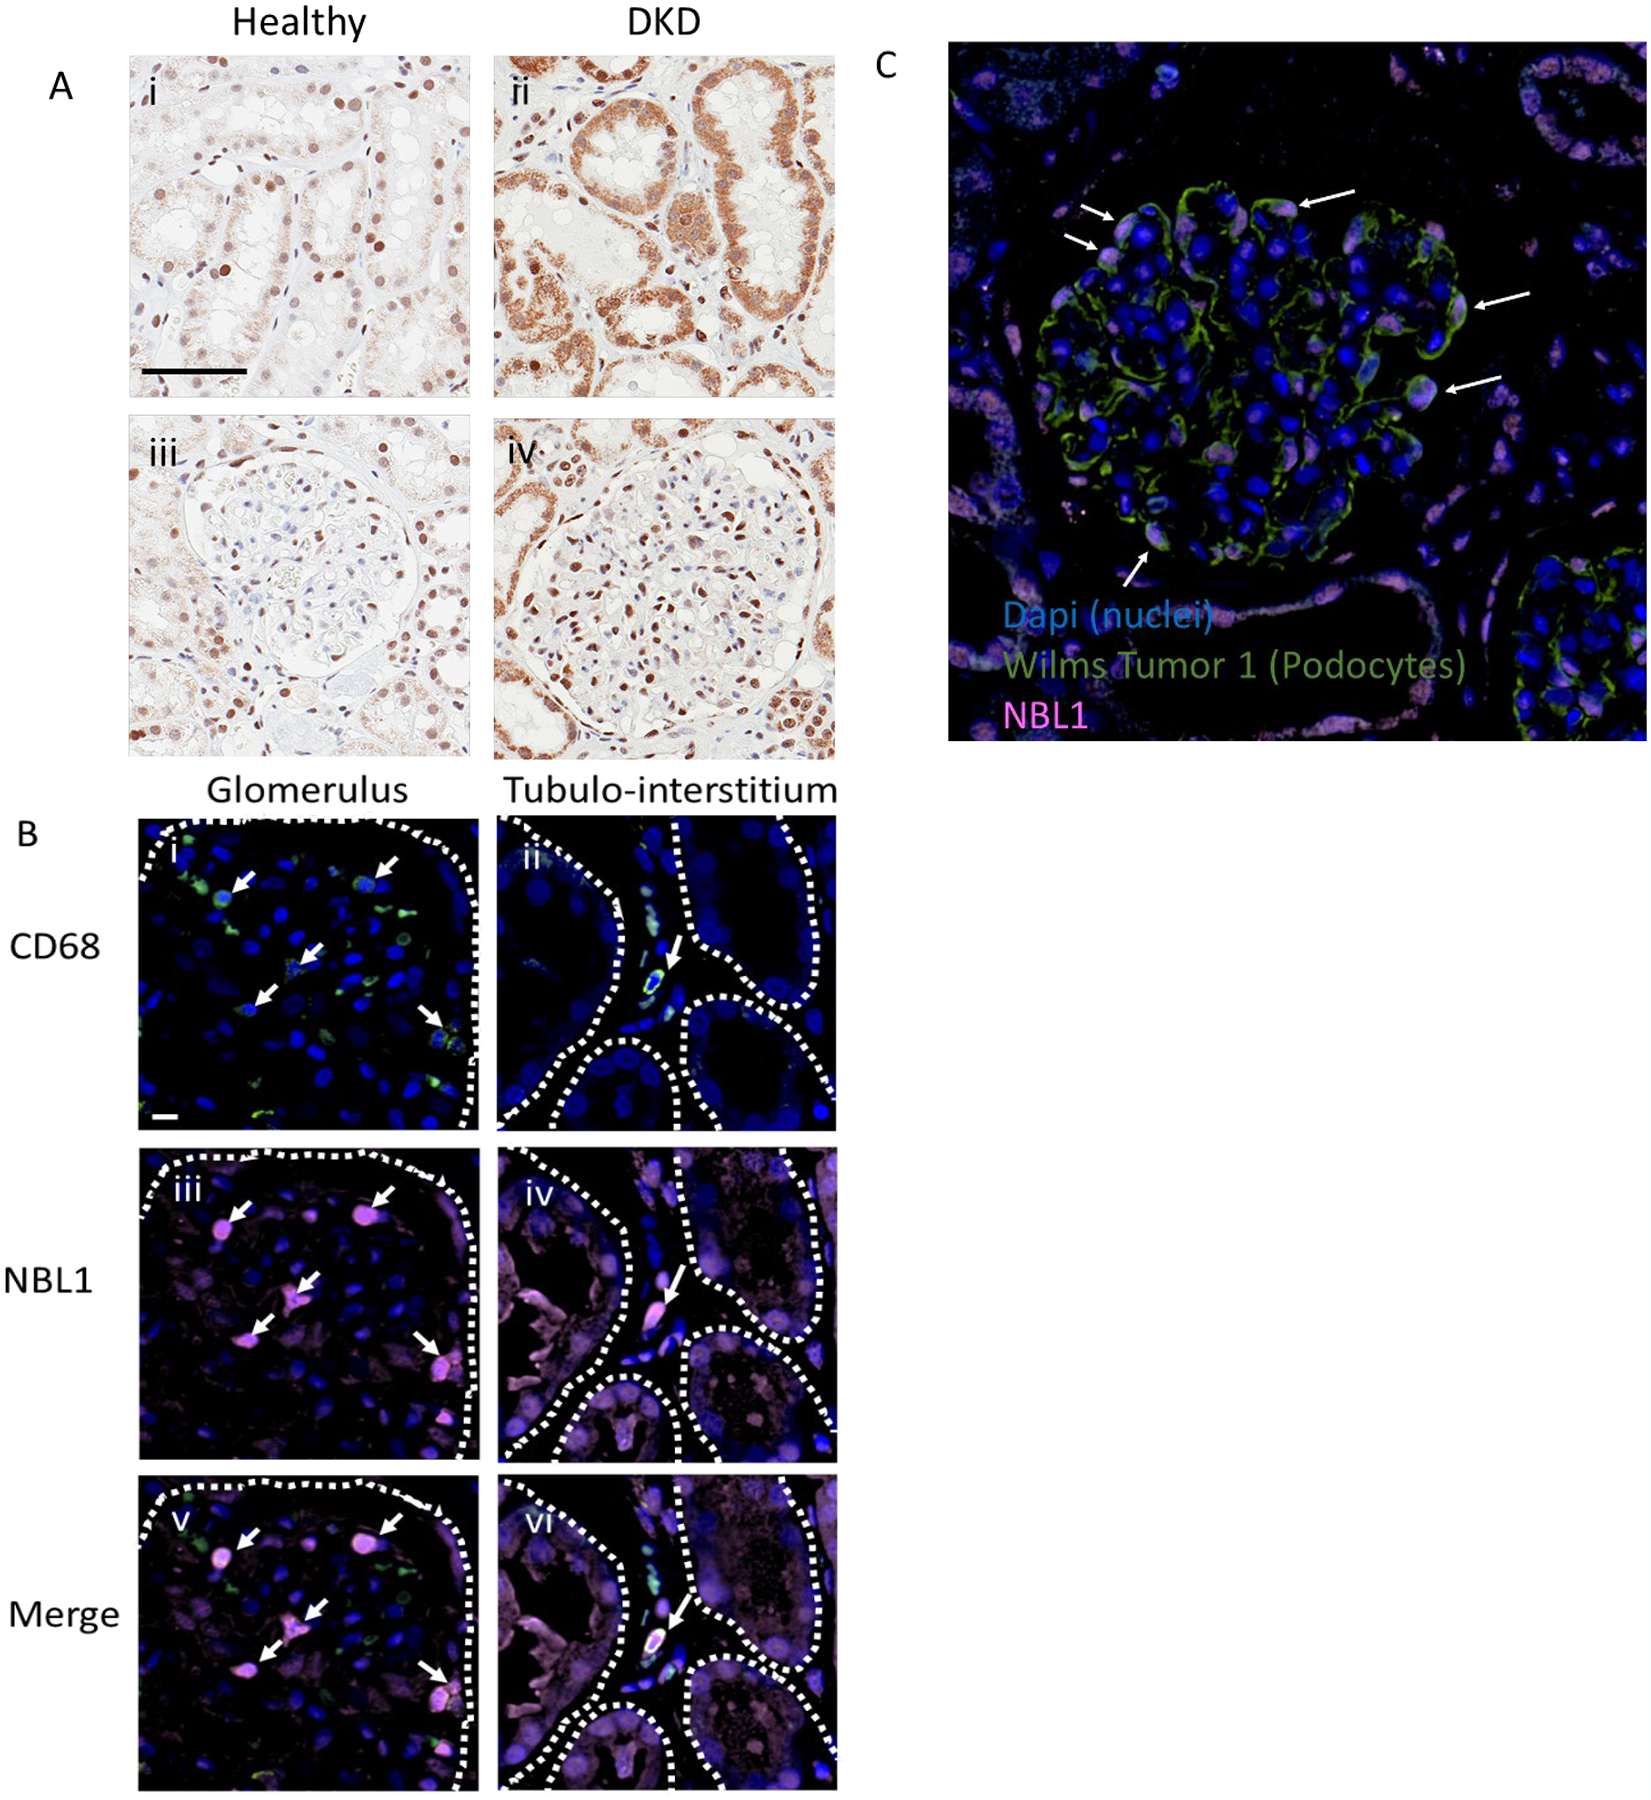
Fig. 5. Localization of NBL1 in kidney from healthy and DKD subjects.

Panel A. Representative 40x IHC images show proximal tubule (i, ii) and glomerular (iii, iv) localization of NBL1 (brown stain) in healthy (i, iii), and DKD kidney (ii, iv). The magnification Bar in panel i represents 60μm. Both podocyte and proximal tubule epithelial cells exhibit strong NBL1 staining in diabetic kidney disease tissue tested from 32 patients.
Panel B. Representative 60x images show co-localization of NBL1 (iii and iv, pink) with CD68 positive macrophages (i and ii, green) in a glomerulus (left panels) and interstitium (right panels) of kidney tissue from a patient with diabetic kidney disease. The NBL1 positive macrophages are marked by white arrows. NBL1 staining is also present in tubular epithelial cells (iv and vi). Cell nuclei are stained with Dapi (blue). Glomerular Bowman’s capsule (i, iii, and v) and tubules (ii, iv, and vi) are outlined with dashed white line. The magnification bar in panel B represents 20μm.
Panel C. Representative 40x image showing glomerular colocalization of NBL1 (pink) and Wilms Tumor-1 (WT-1, green, podocyte cell specific marker). Characteristic WT-1 positive podocytes in a diabetic kidney are labeled with arrows indicating colocalization of NBL1 signal in podocytes.
