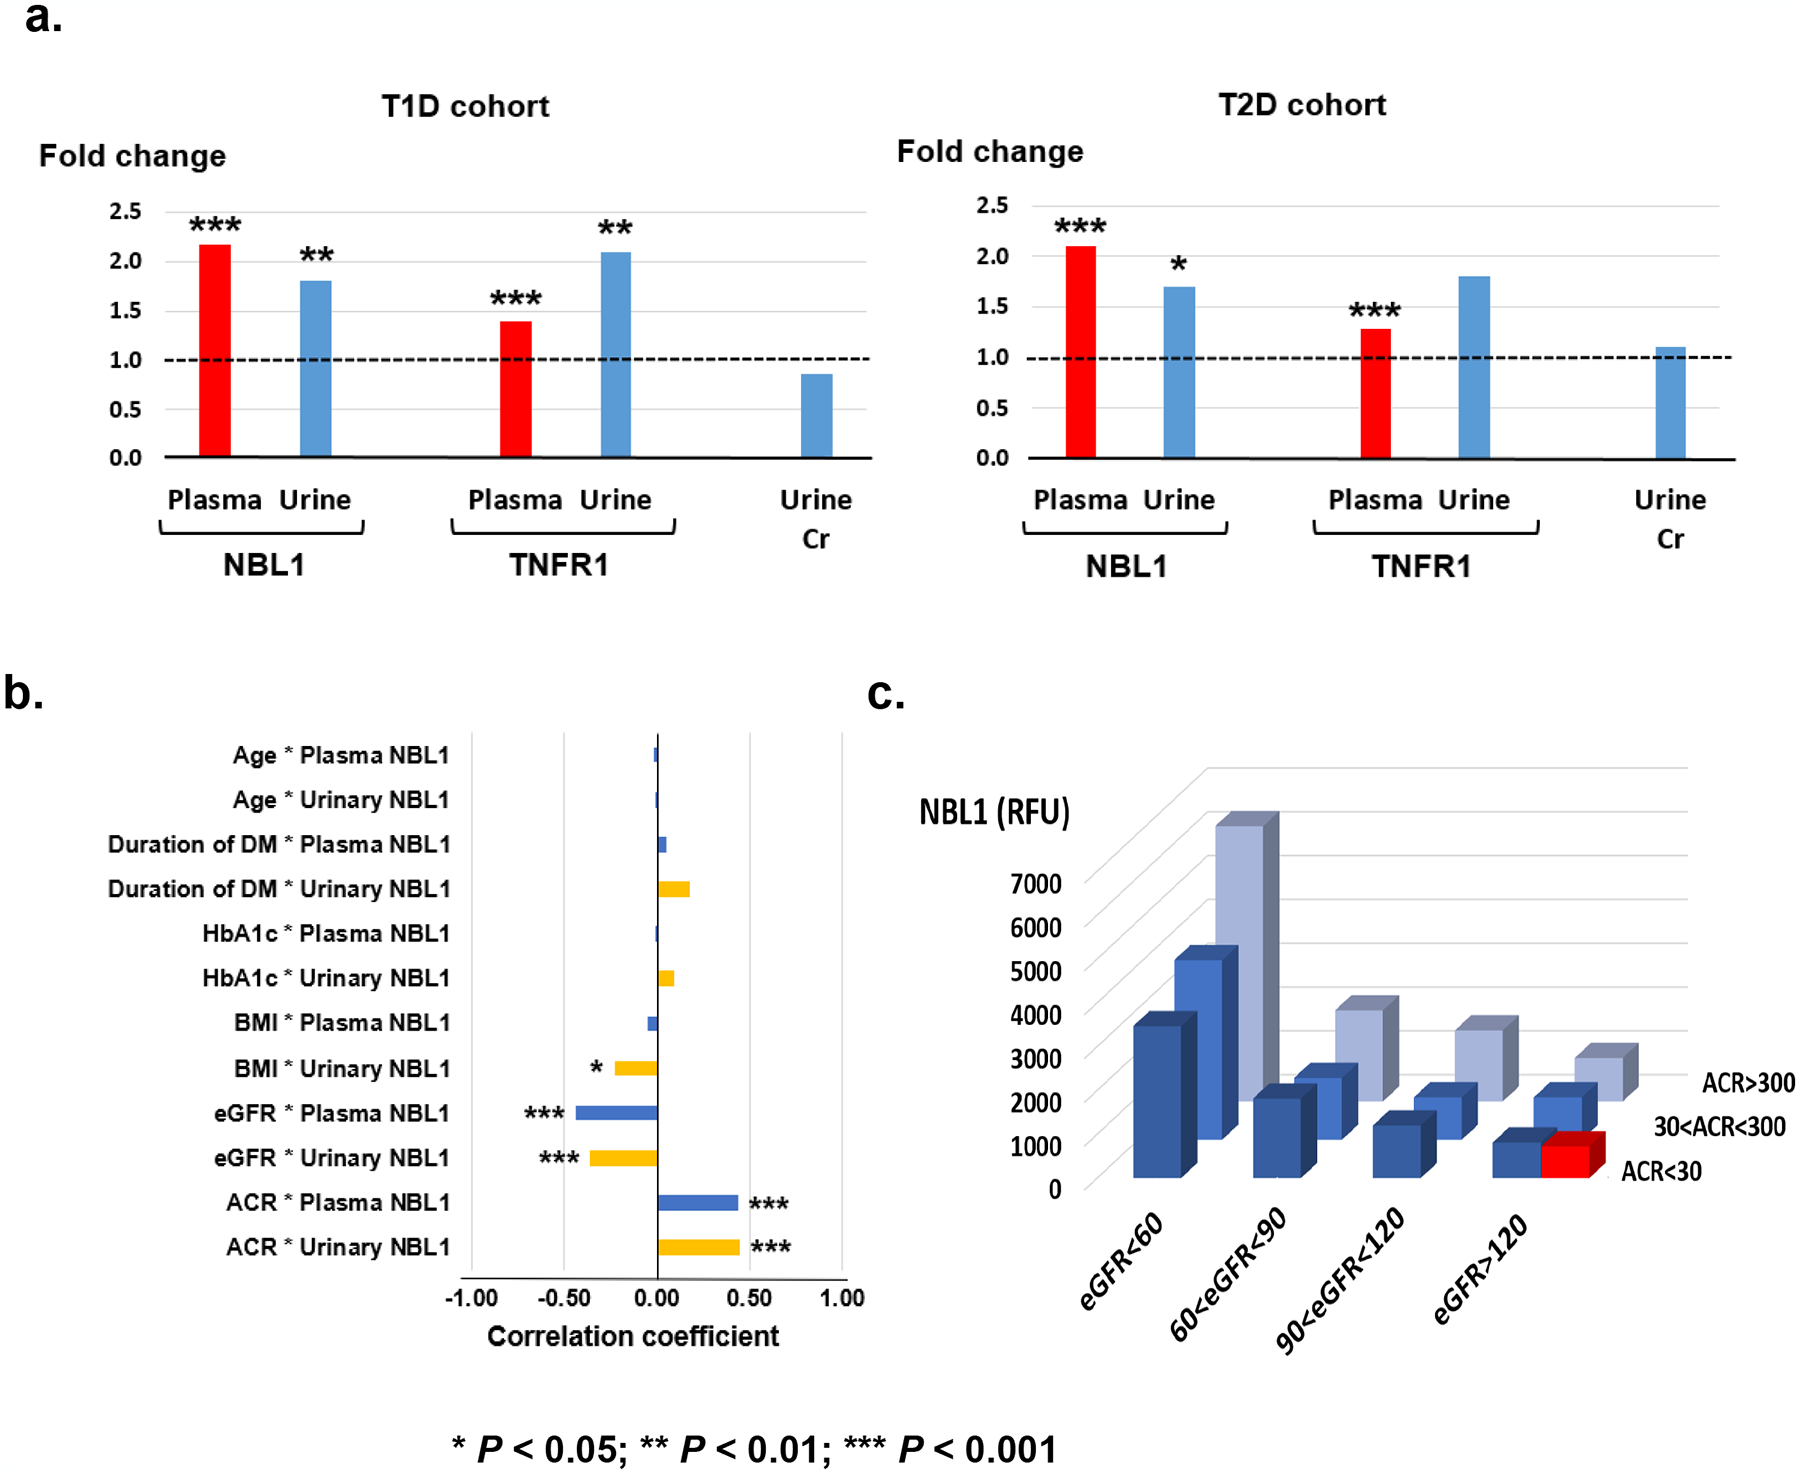
Fig. 7 |. Association of circulating NBL1 with clinical characteristics.

a. Fold changes in plasma concentrations of NBL1 and TNFR1 in cases over controls in T1D discovery (n=219) and T2D replication (n=144) cohorts. Fold changes in urine concentrations of NBL1 and TNFR1 normalized by urinary creatinine in cases over controls in nested case-control study of T1D (n=60) and T2D (n=52) subjects selected from the Joslin late DKD cohorts.
b. Spearman rank correlation coefficient between baseline plasma NBL1 concentrations and clinical characteristics in Joslin T1D with early DKD (n=238), and urinary NBL1 concentrations and clinical characteristics in T1D (n=60) and T2D (n=52) subjects selected from the Joslin late DKD cohorts.
c. Mean circulating NBL1 concentrations in relative fluorescence units (RFU) according to categories of baseline eGFR (ml/min/1.73m2) and ACR (mg/g) in Joslin T1D combined cohorts (n=457) and healthy controls (n=79). Red box shows mean RFU in healthy controls (see also Supplementary Fig. 7). There was no significant difference between concentrations of NBL1 in subjects with diabetes (ACR <30 mg/g and eGFR>120 ml/min/1.73m2) and in healthy controls (813 ± 393 vs 723 ± 150, P > 0.05).
