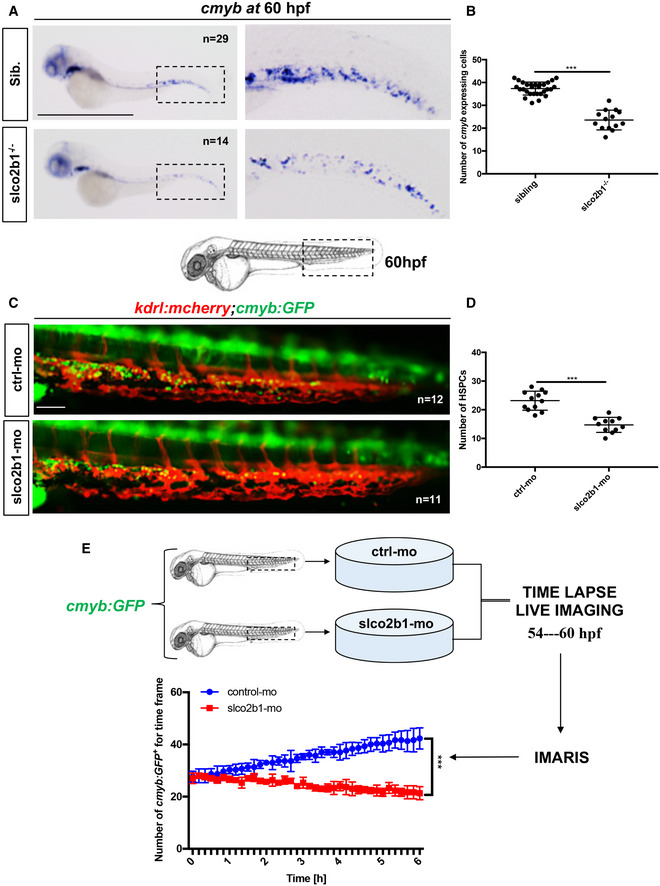
Figure 3. The deficiency of slco2b1 induces a decrease of HSPC in the CHT.

-
AWISH for cmyb expression at 60 hpf in wild‐type and slco2b1 −/− embryos.
-
BQuantification of cmyb‐expressing cells. Each n represents the number of cmyb‐expressing cells for each embryo (biological replicates). Each experiment has been repeated three independent times.
-
CSchematic indicating the imaging area in the tail at 60 hpf, as indicated by the black box; fluorescence imaging in the CHT of kdrl:mCherry;cmyb:GFP embryos injected with control‐ and slco2b1‐Mos.
-
DQuantification of HSPCs associated with ECs. Each n represents the number of yellow spots for each embryo (biological replicates). Each experiment has been repeated three independent times.
-
EExperimental outline and quantification of time‐lapse live imaging in controls and slco2b1‐morphants cmyb:GFP + cells, using Imaris software.
Data information: Center values denote the mean, and error values denote s.e.m. The statistical analysis was completed using an unpaired two‐tailed t‐test. ***P < 0.001. Scale bar is 500 μm (A); 200 μm (C).
Source data are available online for this figure.
