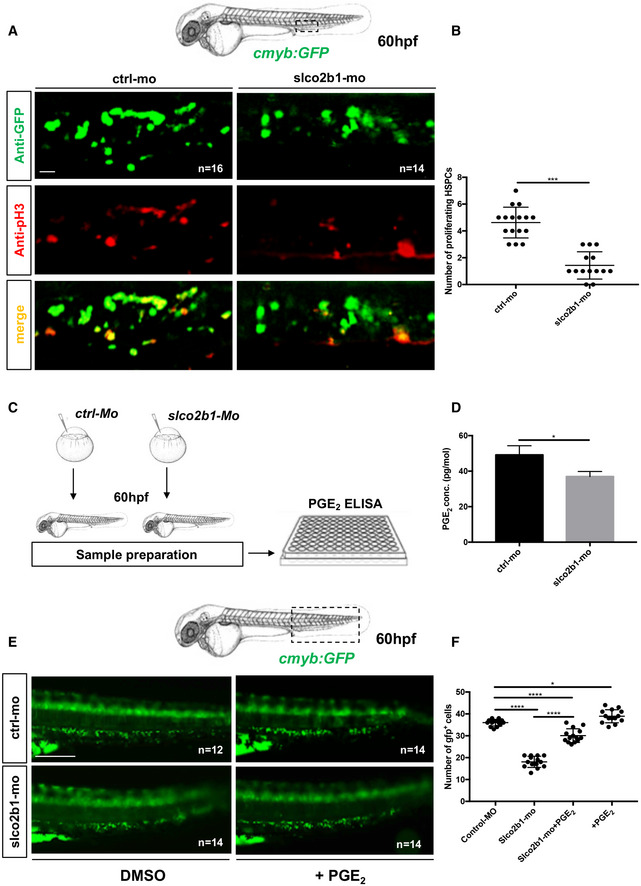
Figure 4. The defect in HSPCs proliferation in slco2b1‐deficient embryos can be rescued by PGE2 treatment.

-
AAnti‐GFP and pH3 immunostainings of either controls (Ctrl‐Mo) or slco2b1‐morphants (slco2b1‐MO) cmyb:GFP embryos.
-
BQuantification of the number of the pH3+ HSCs in controls or slco2b1‐morphants. Center values denote the mean, and error values denote s.e.m, statistical analysis was completed using an unpaired two‐tailed t‐test. ***P < 0.001.
-
CExperimental outline to measure PGE2 level by ELISA kit in control and slco2b1‐MO at 60 hpf.
-
DQuantification of PGE2 concentration in control‐ and slco2b1‐morphants. The statistical analysis was completed using an unpaired two‐tailed t‐test *P < 0.01. Center values denote the mean, and error bars denote s.e.m.
-
EFluorescence imaging in the CHT of cmyb:GFP embryos injected with control‐ and slco2b1‐MOs and treated with PGE2.
-
FQuantification of GFP‐positive cells. Statistical analysis: one‐way ANOVA, multiple comparison, *P < 0.01; ****P < 0.0001. Center values denote the mean, and error bars denote s.e.m. Data information: Scale bar is 50 μm (A); 200 μm (E).
Source data are available online for this figure.
