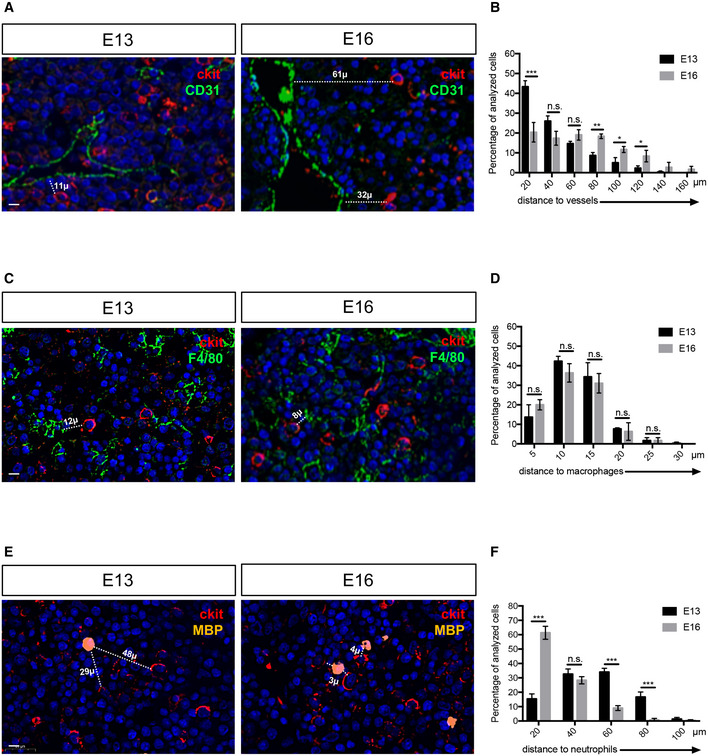
Figure 8. Myeloid and endothelial cells are very close to HSPCs in the mouse fetal liver.

-
AImmunohistochemistry on paraffin sections for cKit (HSPCs marker) and CD31 (endothelial cell marker) at E13 and E16 stages of mouse fetal liver.
-
BDistance distribution between cKithigh cells and endothelial cells (n = 79 from three E13 fetal livers; n = 92 from three E16 fetal livers), binned into 20 μm intervals. Statistical analysis was completed using a t‐test. *P < 0.01; **P < 0.001; ***P < 0.0001. Center values denote the mean, and error values denote s.e.m.
-
CImmunohistochemistry on paraffin sections for cKit (HSPCs marker) and F4/80 (macrophage cell marker) at E13 and E16 stages of mouse fetal liver.
-
DDistance distribution between cKithigh cells and macrophages (n = 54 from three E13 fetal livers; n = 64 from three E16 fetal livers), binned into 5 μm intervals. Statistical analysis was completed using a t‐test.
-
EImmunohistochemistry on paraffin sections for cKit (HSPCs marker) and MBP (neutrophil cell marker) at E13 and E16 stages of mouse fetal liver.
-
FDistance distribution between cKithigh cells and neutrophils (n = 45 from three E13 fetal livers; n = 53 from three E16 fetal livers), binned into 20 μm intervals. Statistical analysis was completed using a t‐test ***P < 0.001.
Data information: All nuclei were marked with DAPI. Scale bar is 20 μm (A–C–E).
