
Figure 3. A mouse model for the simultaneous measurement of energy metabolism in defined immune cell populations.
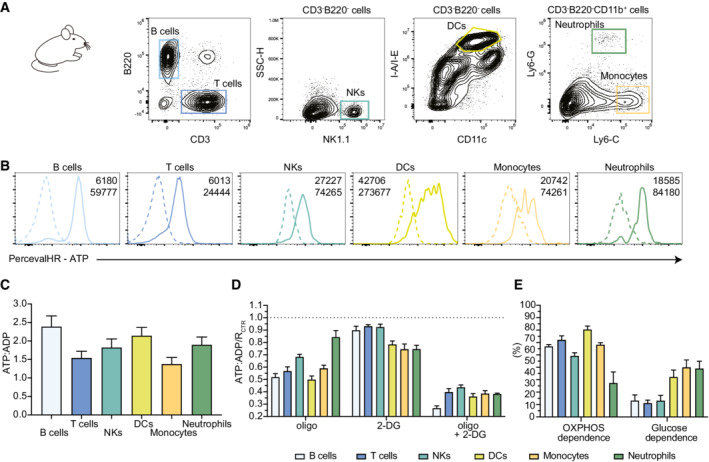
Percevalfl/fl mice were crossed with Vav‐iCre animals to achieve expression of the metabolic reporter in all cells of hematopoietic origin.
-
AGating strategy used from lymph node cells.
-
BReporter expression (as measured by the ATP signal) is detected in all immune cell populations analyzed. Negative dotted lines correspond to the value measured in the C57Bl/6 wild‐type mouse.
-
CATP:ADP ratios measured at steady state in B cells, T cells, NKs, DCs, monocytes, and neutrophils.
-
D, ESPICE‐Met was performed on various lymph node immune cell types simultaneously. (D) ATP:ADP ratios were normalized to the untreated condition and shown for different populations upon treatment with DMSO+H2O as control, oligo, 2‐DG, or oligo+2‐DG. (E) OXPHOS and glucose dependencies were calculated for B cells, T cells, NKs, DCs, monocytes, and neutrophils.
Data information: Results are pooled from three independent experiments (n = 6). Data are represented as mean ± SEM.