
Figure 5. Coexistence of macrophages with distinct energy metabolic profiles in vivo .
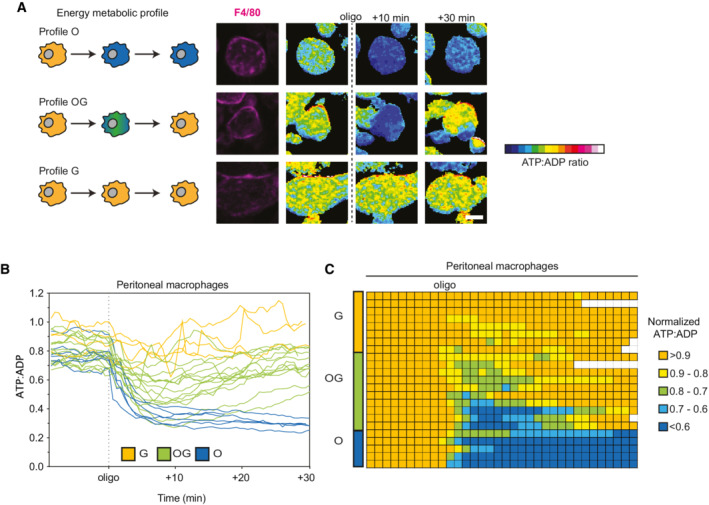
Vav‐iCre x Percevalfl/fl mice were injected i.p. with thioglycolate. Peritoneal macrophages were isolated 3 days later and immediately subjected to SPICE‐Met imaging in the presence of Alexa 594‐conjugated F4/80 antibody.
-
ARepresentative time‐lapse images showing the 3 patterns of ATP:ADP changes in response to oligomycin in peritoneal macrophages. Scale bar, 10 μm.
-
BKinetic analysis of ATP:ADP ratios for single macrophages (n = 25 cells).
-
CTable representing the ATP:ADP variations in individual macrophages (n = 25 cells are shown) treated with oligomycin. Ratios were normalized to the steady‐state values and were color‐coded as indicated. Each line represents one cell, and each square corresponds to 1 min. Results are representative of two independent experiments.