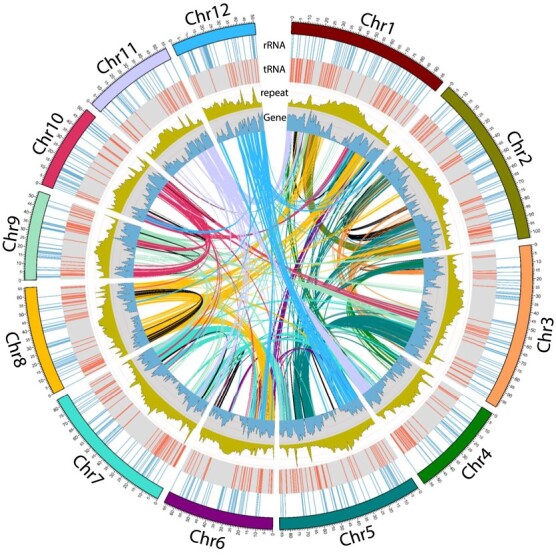
Figure 2.

Circos plot indicating chromosomes on the outer track followed by band graphs of rRNA (blue) and tRNA (red) counts moving inward. Line plots for repeats (olive) and genes (blue) indicate the abundance of corresponding features in million bp bins. The innermost links indicate genomic block duplications (stemming from WGDs), with colours indicating the chromosome of origin except for self-synteny, which is represented in black. rRNAs are concentrated on chromosome arms near centromeres, whereas tRNAs are more abundant toward telomeric regions. Repeats are also highly distributed at centromeric regions of chromosomes. The regions with higher numbers of repeats contain fewer genes. Chr1,5,3 and 2 had largest synteny, whereas Chr2,0 and 8 had largest self-synteny.
