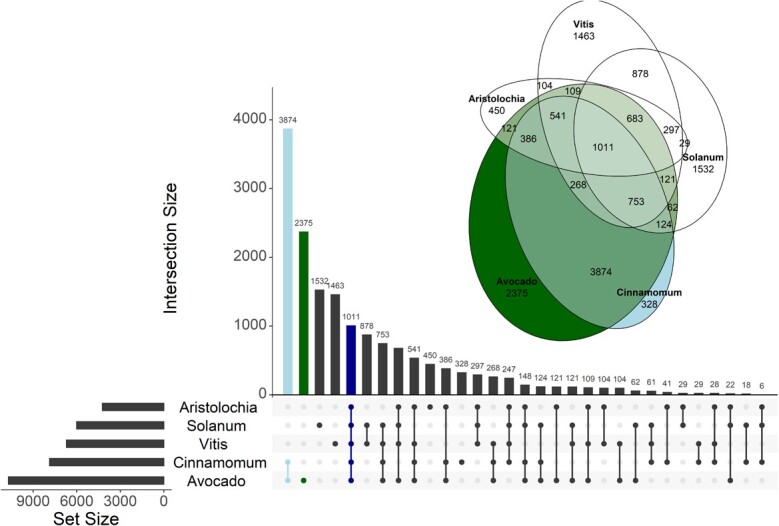
Figure 4.

Gene clustering between 5 plant species (Persea amaricana, Solanum lycopersicum, Vitis vinifera, Aristolochia fimbriata and Cinnamomum micranthum). The bar graph represents the count of sub-clusters for the combinations indicated underneath the graph. The bars corresponding to the avocado and Cinnamomum cluster, cluster specific to avocado, and the cluster containing common sub-clusters to all five species are highlighted in light blue, green and blue respectively. The Euler diagram indicates weighted sub-cluster count for five species, where avocado is represented in green and Cinnamomum, the closely related species, is represented in light blue.
