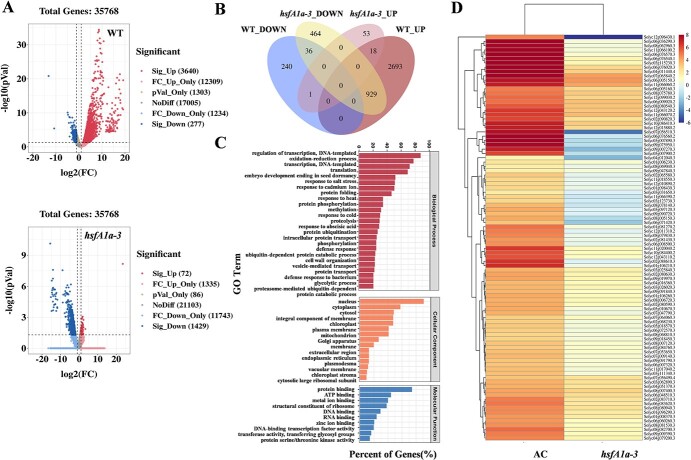
Figure 2.
DEGs in WT and hsfA1a mutant anthers under heat stress. (A) Volcano plot of DEGs. Red and blue dots represent up- and downregulated genes, respectively, in anthers of WT and hsfA1a mutants after heat stress. (B) Venn diagram showing the number of genes significantly changed under heat stress in WT and hsfA1a anthers. (C) Classification of heat-induced genes in anthers of WT and hsfA1a mutants by using Gene Ontology (GO) functional annotation from Venn diagrams. (D) Heat map of DEGs for antioxidant, protein protection, and degradation-related genes in anthers of WT and hsfA1a mutants after heat stress. The color scale represents the different log2 (FPKM) values of DEGs. hsfA1a-3, one line of hsfA1a mutant.

