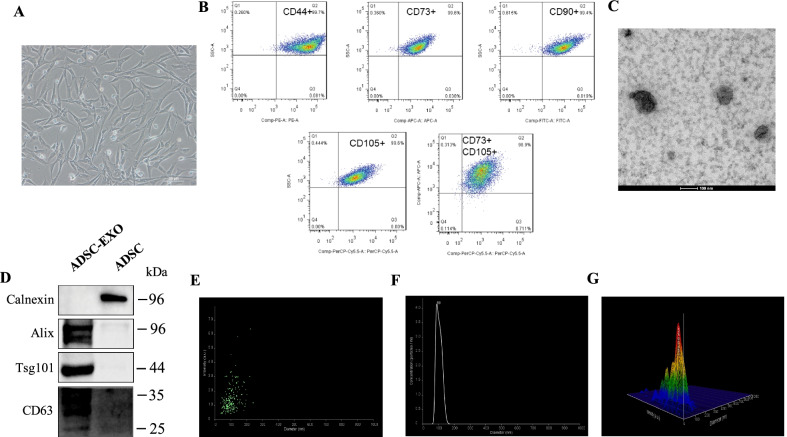
Fig. 1.
Identification of ADSCs and ADSCs-derived exosomes. A Cytomorphology of P3-ADSCs was observed under optic microscope. B Flow cytometry analysis for ADSCs markers (including CD44, CD73, CD90, CD105) in P3-ADSCs. C Transmission electron microscopic (TEM) analysis for ADSCs-derived exosomes (scale bar 100 nm). D Western blot analysis of exosomal protein markers Alix, Tsg101, CD63 and ER marker Calnexin in ADSC-EXO lysate, ADSC protein as control. E–G Nanoparticle tracking analysis (NTA) for ADSC-EXO size distribution, concentration and intensity

