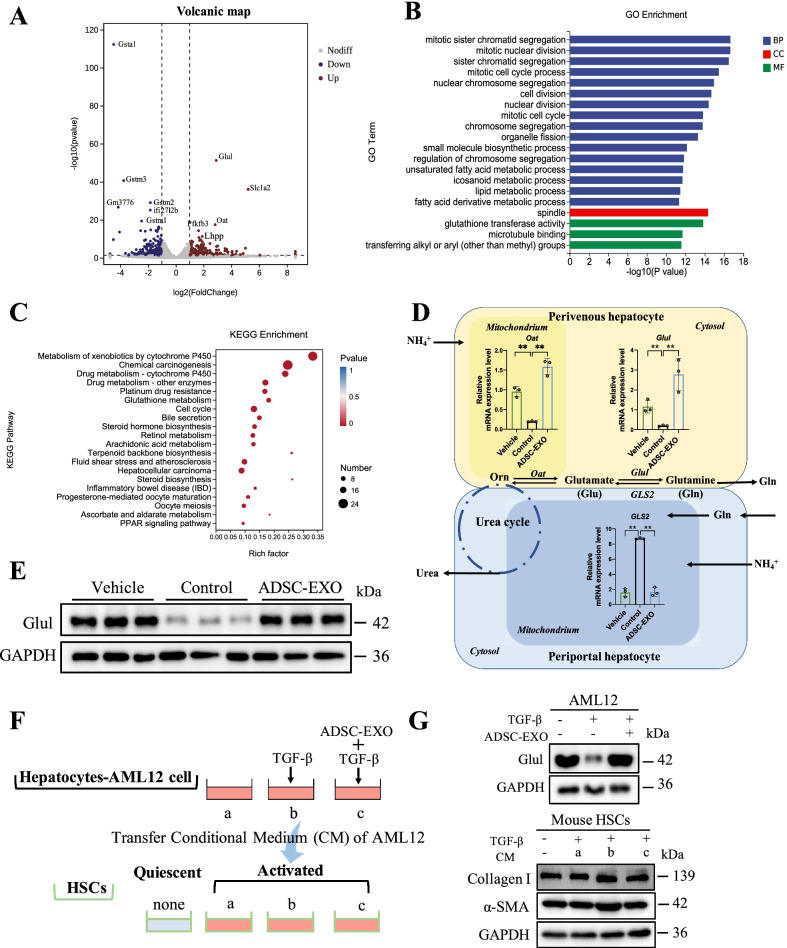
Fig. 5.
Hepatic Glul was up-regulated in mice treated with ADSC-EXO. RNA-Seq analysis was conducted in total liver mRNA, which was extracted from control mice (DEN/CCl4-treated, n = 4) and ADSC-EXO mice liver tissue (DEN/CCl4 + ADSC-EXO-treated, n = 4). A Volcanic map of different expression genes (DEGs) between control group and ADSC-EXO group. Red spots represent up-regulated genes and blue spots as down-regulated genes. B GO term enrichment for control group and ADSC-EXO group. C KEGG pathways analysis of control group and ADSC-EXO group. D Relative mRNA expression level of key enzymes involving in glutamine and ammonia metabolism in mice liver, including Glul, GLS2 and Oat. Additionally, glutamine and ammonia metabolic process catalyzed by Glul, GLS2 and Oat in perivenous hepatocyte and periportal hepatocyte was described in this diagram. E Protein expression level of Glul in mice liver tissue was detected by western blot analysis. (Each lane represents one mouse, 3 replicates.) F Scheme illustration of the research model for cross talk between mouse hepatocytes and HSCs. a, b, c all represented the conditional medium (CM) of AML12 cells under three different treatments, respectively. G (Up) Western blot analysis of Glul protein level in untreated AML12 cells, AML12 cells with 48 h TGF-β1 treatment (5 ng/ml) for injured and injured AML12 cells exposed to ADSC-EXO (200 μg/ml) for another 24 h. (Down) Western blot analysis of α-SMA and Collagen I protein level in quiescent mHSCs or activated mHSCs with different AML12 cells conditional medium treatment. GAPDH as internal reference. All data are shown as the mean ± SEM, *p < 0.05, **p < 0.01 comparing with corresponding controls by unpaired t test between two groups. Aberrations: DEG, different expression genes; Orn, ornithine; Glu, glutamate; Gln, glutamine; Oat, ornithine δ-aminotransferase; Glul, glutamine synthetase; GLS2, liver-type glutaminase; and CM: conditional medium

