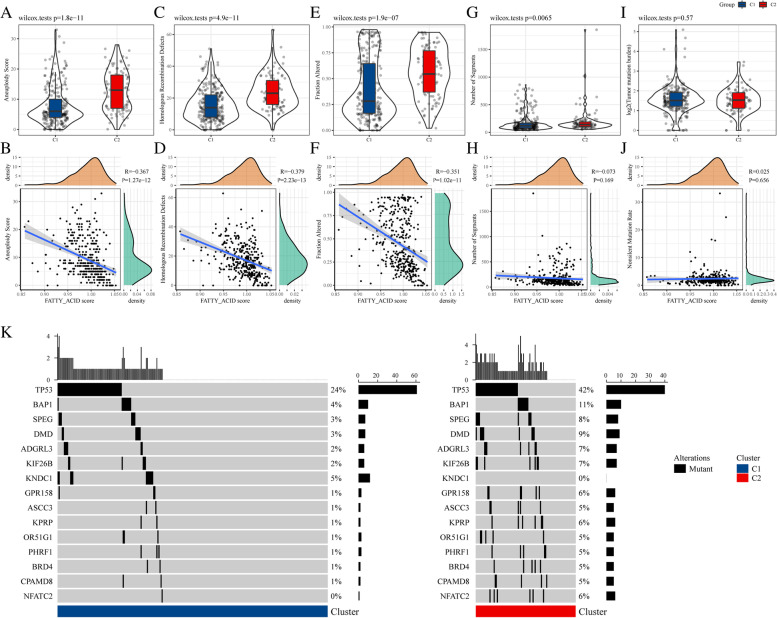
Fig. 3.
Genomic mutations of the TCGA cohort molecular subtypes. A, C, E, G, I Comparison of aneuploidy scores, homologous recombination defects, fraction altered, number of segments and nonsilent mutation rates in the molecular subtypes of the TCGA cohort. B, D, F, H, J Correlation analysis between FA metabolism activity and aneuploidy scores, homologous recombination defects, fraction altered, number of segments and nonsilent mutation rates in the TCGA cohort. K Somatic mutation analysis of the two molecular subtypes. Abbreviations: FA, Fatty acid; TCGA, The Cancer Genome Atlas

