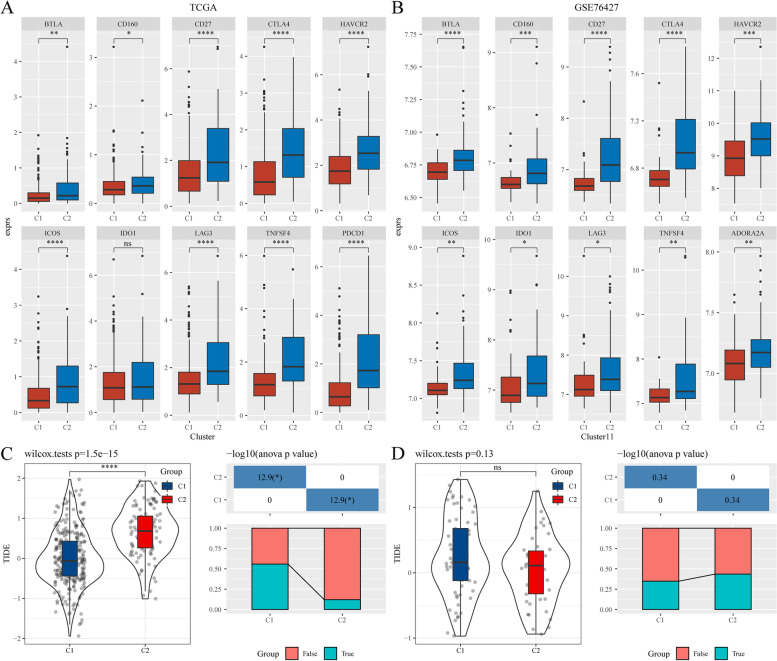
Fig. 6.
Analysis of the difference in immunotherapy in FA metabolism-related lncRNA subgroups. A, B The boxplots display the immune checkpoints that were up-regulated in C1 compared with C2 in the TCGA and GSE76427 cohorts. C Differences in the TIDE score and immune response status of the different molecular subtypes in the TCGA cohort. D Differences in the TIDE score and immune response status of the different molecular subtypes in the GSE76427 cohort. Abbreviations: FA, Fatty acid; lncRNA, Long non-coding RNA; TCGA, The Cancer Genome Atlas; TIDE, Tumor Immune dysfunction and exclusion

