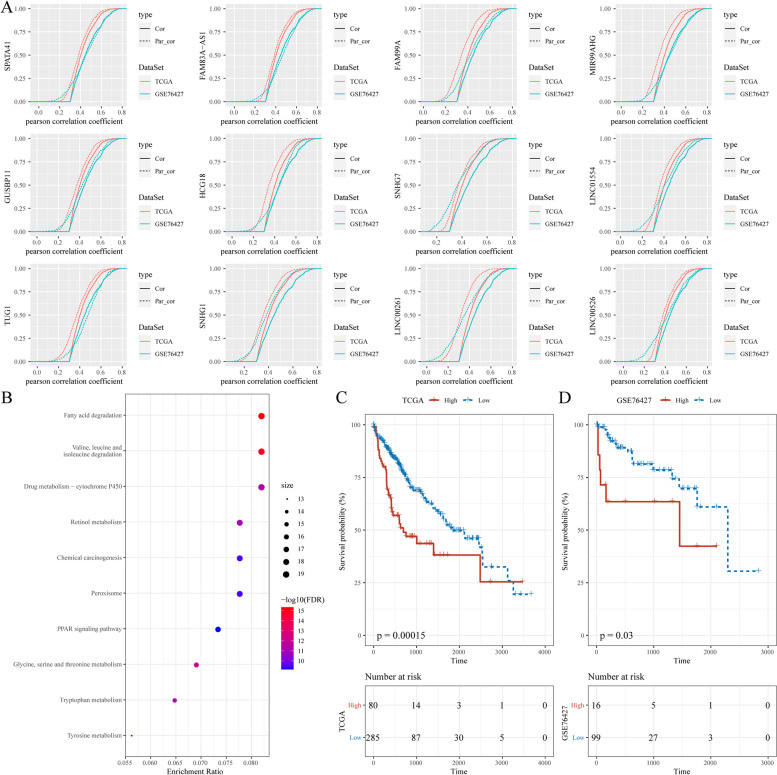
Fig. 8.
Identification of core lncRNAs related to FA metabolism. A The CDF of FA metabolism-related genes, with or without adjusting the first-order partial correlation of lncRNA. The solid line represents the CDFs of the correlation coefficient between the unadjusted FA metabolism scores and gene expression, and the dotted line represents the first-order partial correlation adjustment relationship between FA metabolism scores and gene expression. The two distributions were compared using the Kolmogorov–Smirnov test. The x-axis represents the Pearson’s correlation coefficient between FA metabolism scores and gene expression, and the y-axis represents the cumulative probability. B Enrichment analysis of genes significantly related to lncRNAs. C, D Kaplan–Meier curve of the high- and low- risk clusters in the TCGA and GSE76427 cohorts. Abbreviations: FA, Fatty acid; lncRNA, Long non-coding RNA; CDF, Cumulative distribution curve

