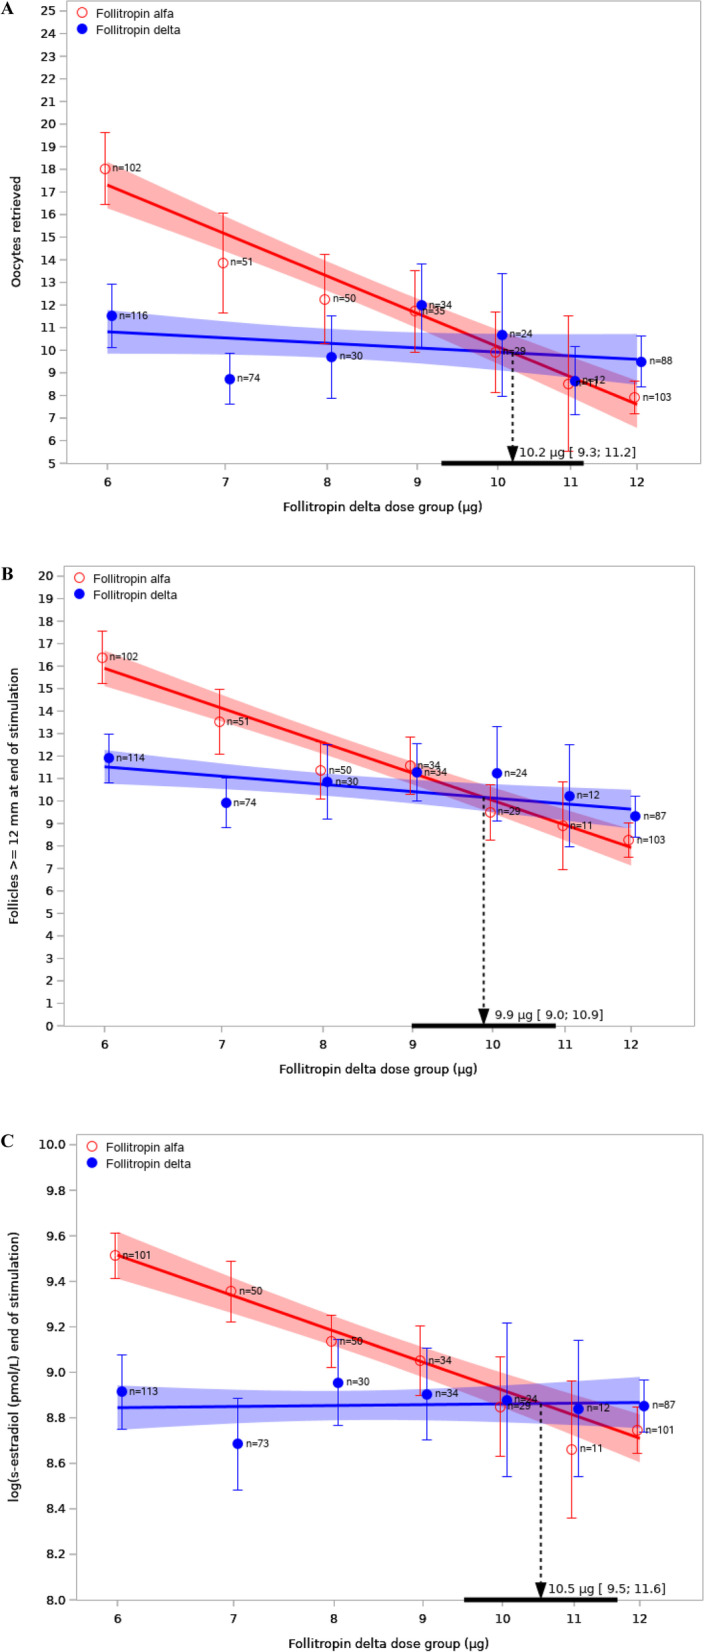
Fig. 4.

Analysis of dose equivalence. Note: A Number of oocytes retrieved for follitropin delta and 150 IU/day follitropin alfa in the study (n = 759); B Number of follicles ≥ 12 mm at end of stimulation for follitropin delta and 150 IU/day follitropin alfa in the study (n = 759); C Log of serum oestradiol concentrations at the end of stimulation for follitropin delta and 150 IU/day follitropin alfa in the study (n = 759). Estimated means (circles) with 95% confidence intervals (95% CI) and number of patients for the subgroups based on the dose of follitropin delta corresponding to the patients’ AMH concentrations and body weight. The intersection of the blue and red regression lines indicates the dose of follitropin delta estimated to give the same response as 150 IU of follitropin alfa. The estimate dose equivalence factor and its 95% CI are indicated by the arrow and the solid horizontal black line on the x-axis
