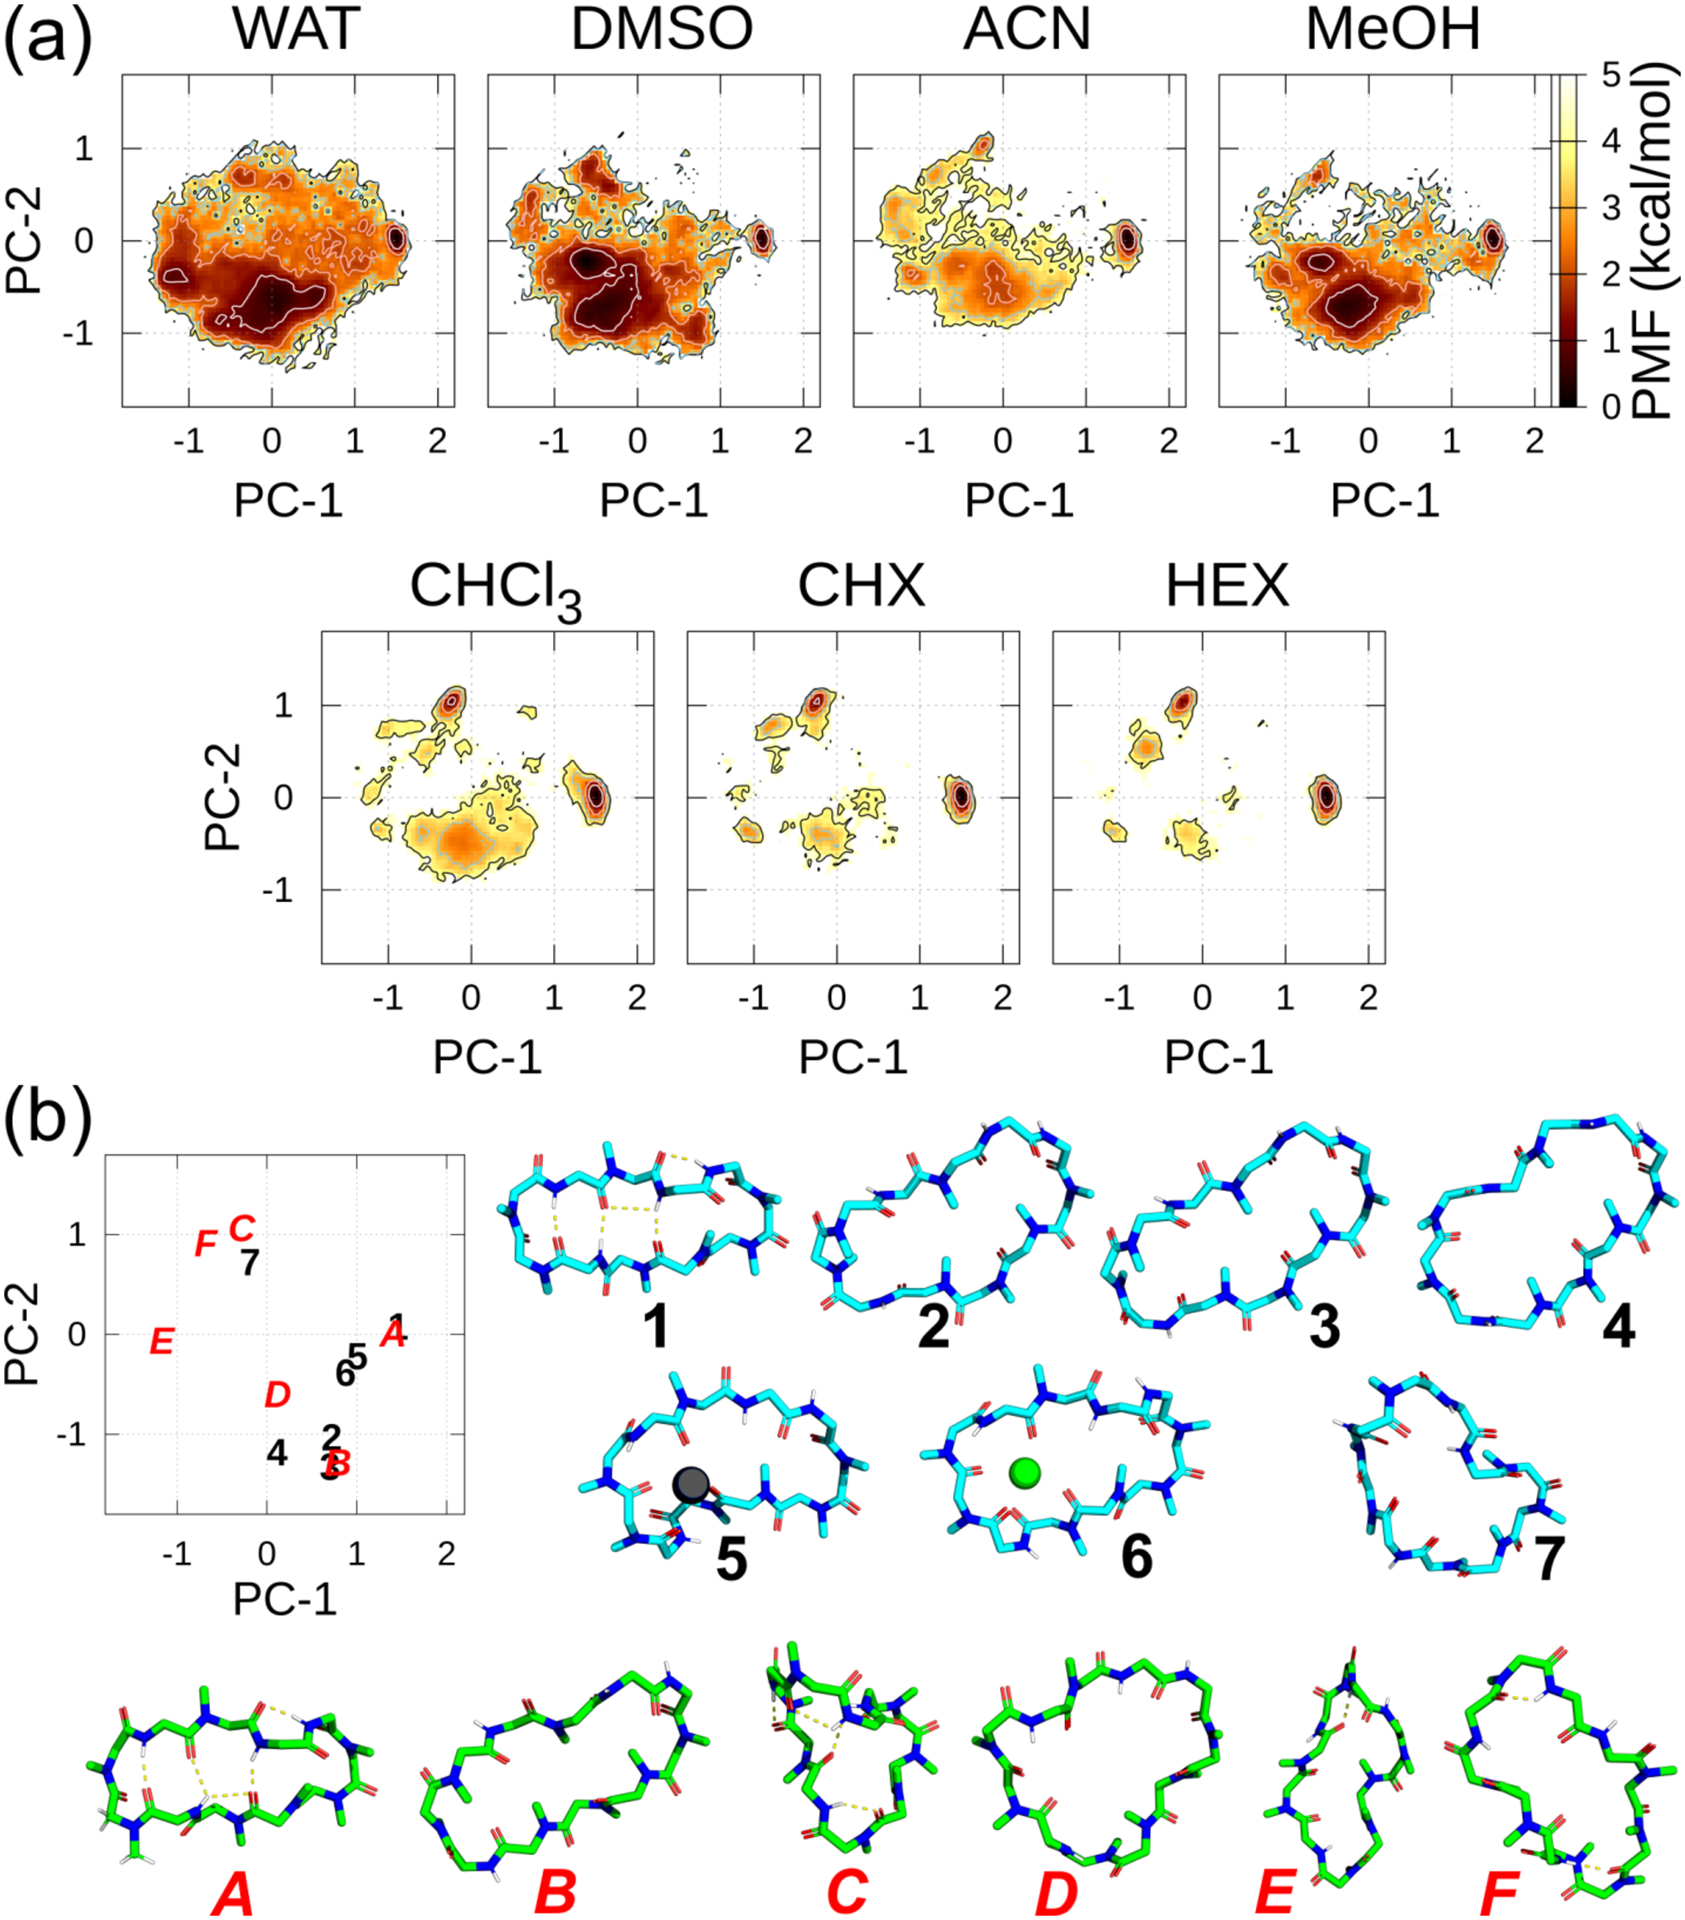
Figure 2.

(a) FELs along the PC-1 and PC-2 axes in each solvent at 300 K using ff03. The contour lines of the PMF = 1.0, 2.0, 3.0, and 4.0 kcal/mol are represented by the white, pink, sky-blue, and black lines, respectively. (b) Relations between the position on the graph and the 3D conformation along the PC plane. In the PC plane, experimentally derived conformations are denoted as black Arabic numbers and actual conformations are shown in sky-blue carbons. The other selected metastable conformations along the PC plane in the T = 300 K ensembles are denoted by red italicized capital letters and conformations are shown in green carbons. Notably, 1 and A almost overlapped completely along the PC plane. Experimentally derived main chain and N-methyl conformations: 1, closed (DEKSAN, source: CSD); 2, open (2Z6W, source: PDB); 3, open (1CSA, source: PDB); and 4, “very open” (1IKF, source: PDB). The following conformations were derived by combining the experimental and computational methods: 5, complexed with Pb2+ (the atomic coordinates of the complex listed in SI of Ref. 16); 6, complexed with Sr2+ (the atomic coordinates of the complex listed in SI of Ref. 17); and 7, complexed with SDS micelles (the atomic coordinates in SI of Ref. 18). Some selected metastable conformations that were detected in FELs: A–F. The antiparallel beta-strand structure 1 was set as the horizontal orientation, and conformations 2–7, as well as A–F, were superimposed to 1.
