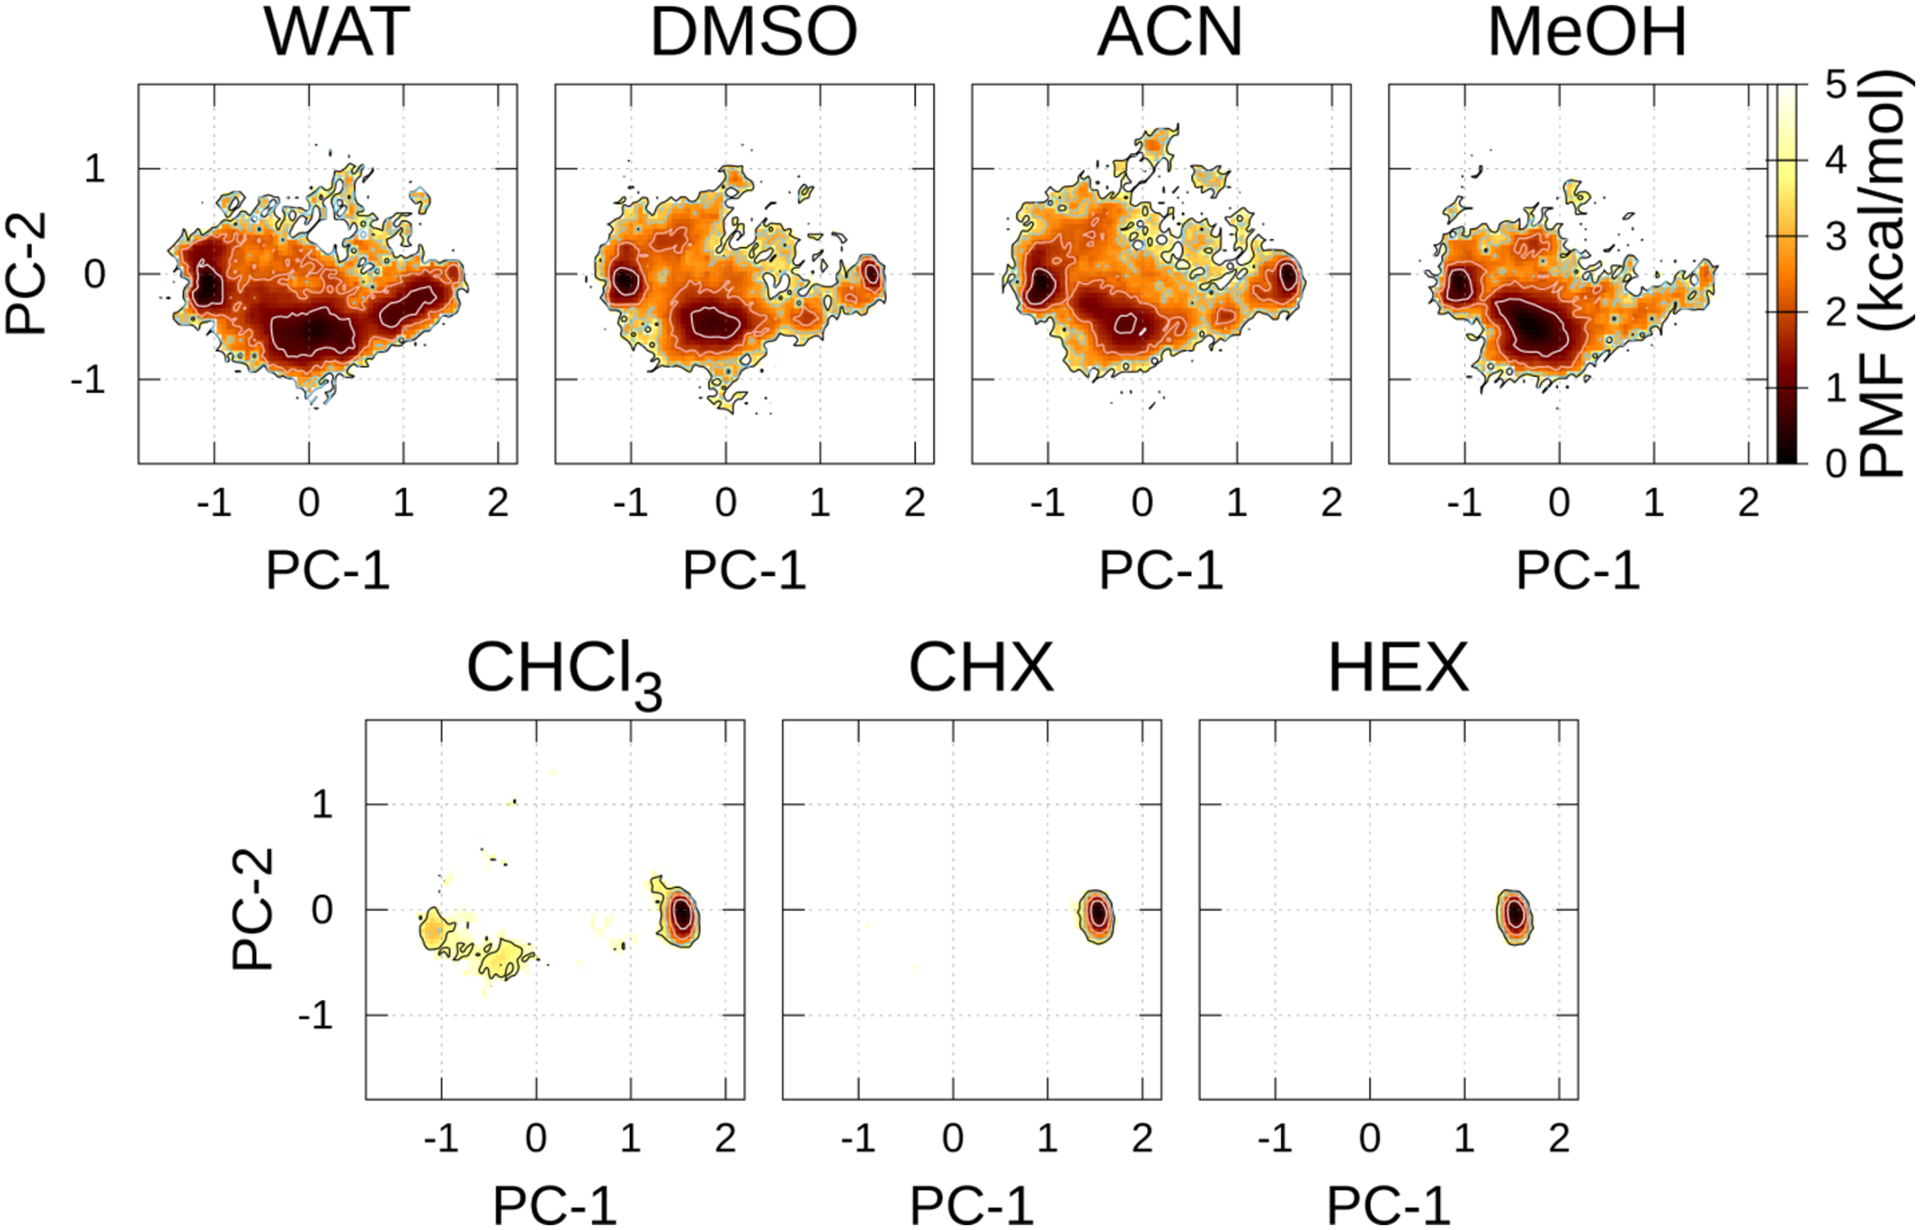
Figure 3.

FELs along the PC-1 and PC-2 axes in each solvent at 300 K using AMBER10:EHT. The contour lines of the PMF = 1.0, 2.0, 3.0, and 4.0 kcal/mol are represented by the white, pink, sky-blue, and black lines, respectively.

FELs along the PC-1 and PC-2 axes in each solvent at 300 K using AMBER10:EHT. The contour lines of the PMF = 1.0, 2.0, 3.0, and 4.0 kcal/mol are represented by the white, pink, sky-blue, and black lines, respectively.