Figure 7.
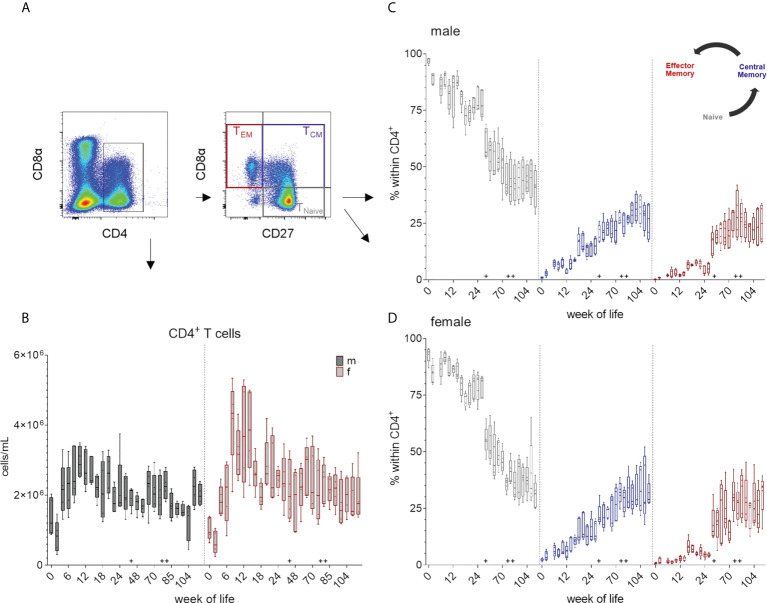
Total numbers of CD4+ T cells and the development of TCM and TEM CD4+ cells over a study period of 126 weeks. (A) Gating strategy to distinguish CD4 T cells and CD8α/CD27-defined subpopulations on the basis of a representative EGM (male, 18 weeks of age). (B) Shows the total CD4+ T cell counts calculated as described above. Sexes are represented by black (male) and red colors (female). (C, D) Changes in the composition of the CD4/CD8α/CD27-defined T cell subsets representing TNaive (CD4+CD8α-CD27+), activated and TCM (CD4+CD8α+CD27+) and TEM (CD4+CD8α+CD27-) in males (C) and females (D). + marks the first bleeding time point after transfer and vaccination, ++ marks the first bleeding time point after booster vaccinations.

