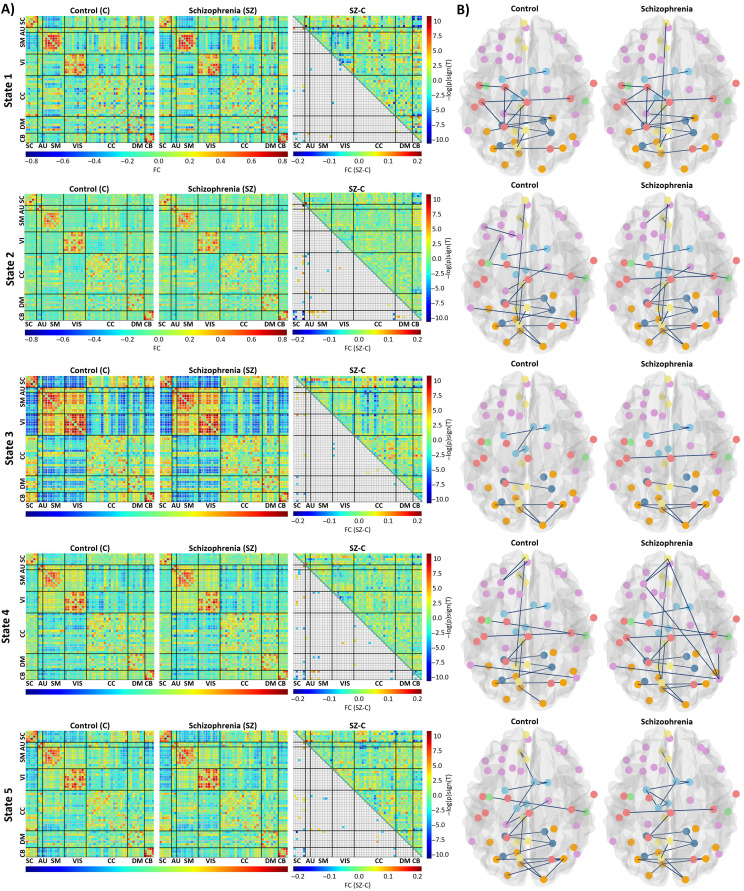
Figure 6. .
(A) Each state’s results include parts of averaged correlation matrices for control and SZ and group differences. The upper triangle is the differences between averaged correlation matrix of SZ and control (SZ-C), and the lower triangle is the result of multiple comparison test. (B) Parts of estimated graphs of the control and SZ groups.

