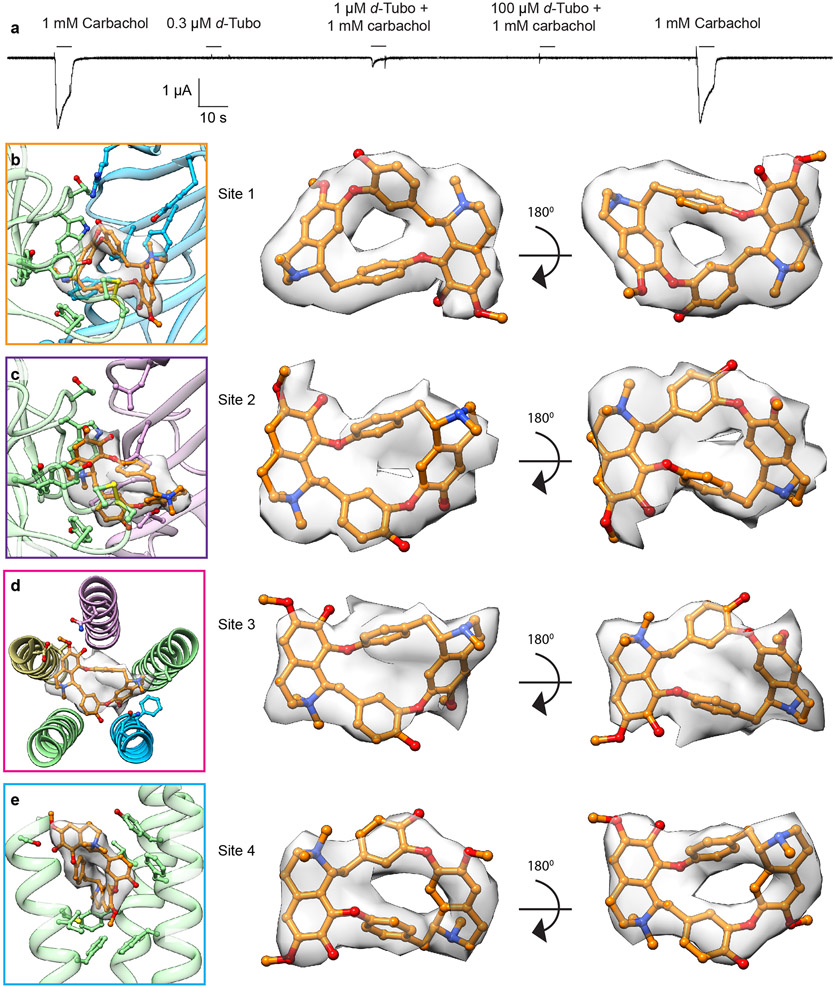
Extended Data Fig. 6. Receptor activation and antagonism by carbachol and d-tubo; d-tubo binding sites with corresponding density maps.
a, Two-electrode voltage clamp (TEVC) recording illustrates receptor antagonism by d-tubo. b, d-Tubo at α/γ interface (site 1). c, d-Tubo at α/δ interface (site 2). d, d-Tubo in the pore (site 3). e, d-Tubo at junction of M1, M3 and M4 helices of the αγ subunit (site 4). Corresponding d-tubo densities are shown as semitransparent surfaces. The d-tubo density was very clear at sites 1 and 4. Site 2 density suggested two different orientations of d-tubo and we modeled the best fitted one. The density at site 3 is poorly resolved suggesting multiple orientations of d-tubo in the pore; we used the unsharpened map to model d-tubo there. Density map was contoured at a threshold of 0.02 for site 1, 2 & 4 and 0.013 for site 3 in UCSF chimera.

