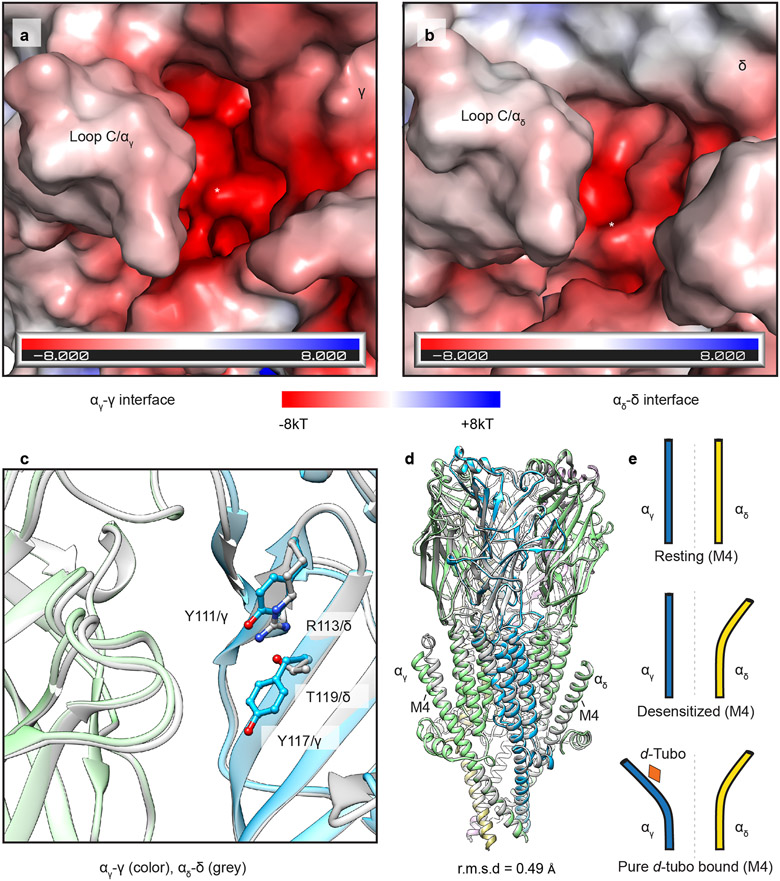
Extended Data Fig. 7. Orthosteric binding-sites details and carbachol vs. d-tubo complex superposition.
a, b, Electrostatic potential of the two orthosteric ligand-binding sites in the apo form; binding pockets are indicated by asterisks. c, Residue differences between two orthosteric ligand-binding sites; αγ/γ as colored (α- green, γ- blue) and αδ/δ as gray. d, Superposition of desensitized and d-tubo bound structures; d-Tubo model is colored (α, green; β, khaki; γ, blue; δ, violet) and desensitized structure is in gray. (E) Conformational difference in M4 of two α-subunits in resting, desensitized and pure d-tubo bound structures.

