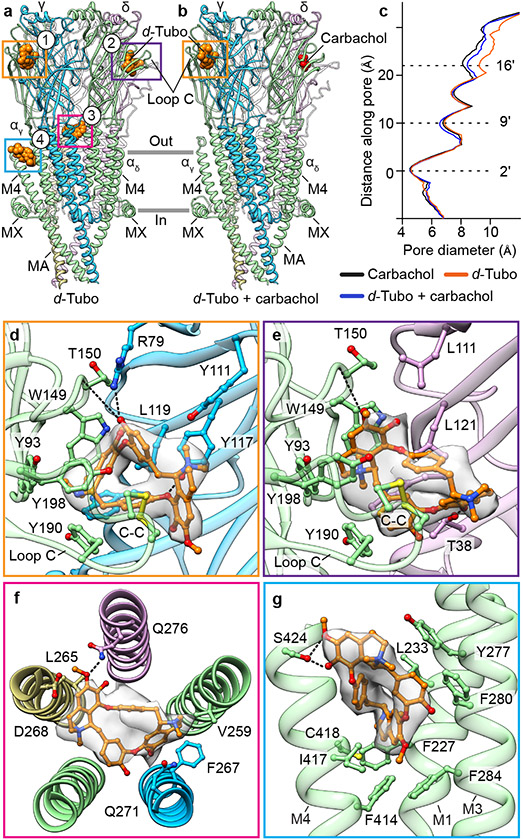
Fig. 5: Structural pharmacology of d-tubocurarine.
a, b, Side views of pure d-tubo bound, and d-tubo plus carbachol bound structures, respectively. α- green, β- khaki, γ- blue, δ- violet; carbachol is shown as red spheres and d-tubo as orange spheres. c, Pore diameter comparison. d, d-Tubo at α/γ interface (site 1). e, d-Tubo at α/δ interface (site 2). f, d-Tubo at pore (site 3). g, d-Tubo at M1, M3 and M4 helices of αγ subunit (site 4). Ligands and interacting residues are shown as sticks and corresponding densities are shown as semitransparent surfaces. Electrostatic interactions are indicated by dashed lines.

