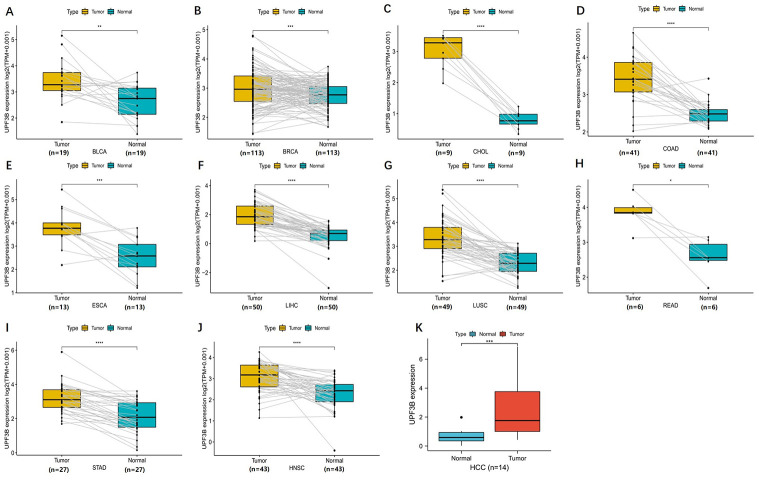
Fig 2. Paired expression analysis of UPF3B in pan-cancer and validate UPF3B expression in liver tumor samples.
(A-J) UPF3B expression in indicated paired tumor and normal tissues in pan-cancer data of TCGA. Gray lines connect paired tissues. (K) qRT-PCR results showed the expression of UPF3B in liver cancer tissues. Data was obtained via The Fourth Hospital of Hebei Medical University. *p < 0.05, **p < 0.01, ***p < 0.001, ****p < 0.0001.

