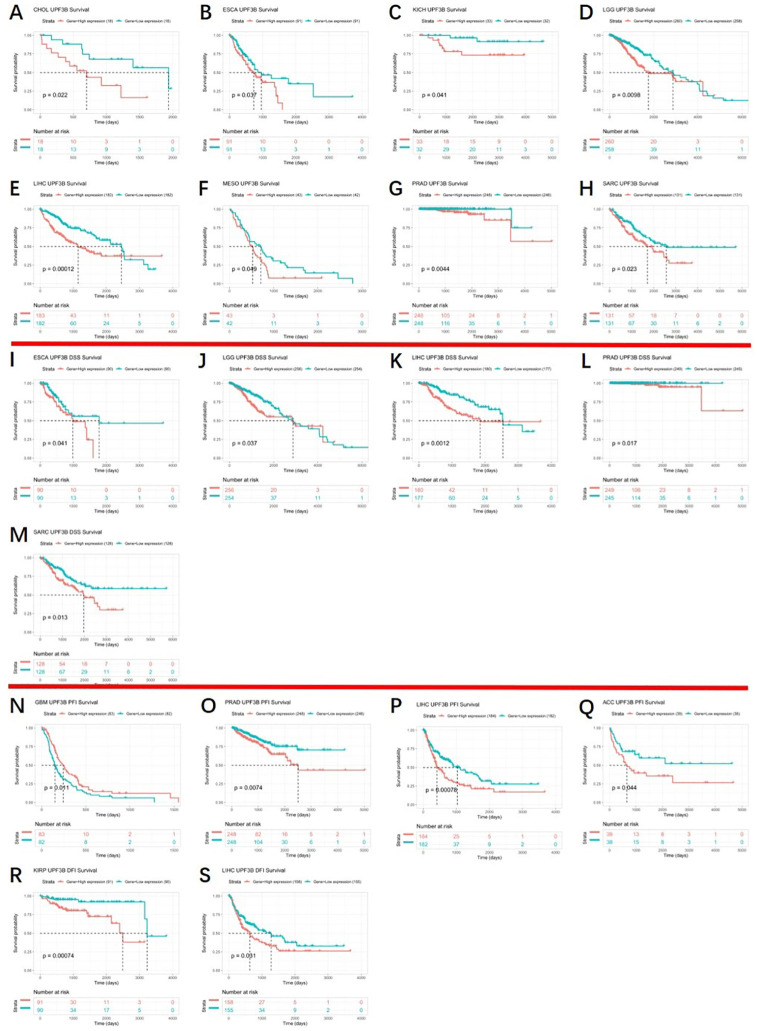
Fig 4. Kaplan–Meier analysis of patient prognosis in 33 TCGA tumor types, group division was based on the median of UPF3B expression.
(A-H) Association between UPF3B expression and OS of cancer patients. (I-M) Correlations of UPF3B expression with DSS of patients. (N-Q) Correlations of UPF3B expression with PFI of patients. (R, S) Correlations of UPF3B expression with DFI of patients. Data was obtained via TCGA. *p < 0.05, **p < 0.01, ***p < 0.001, ****p < 0.0001.

