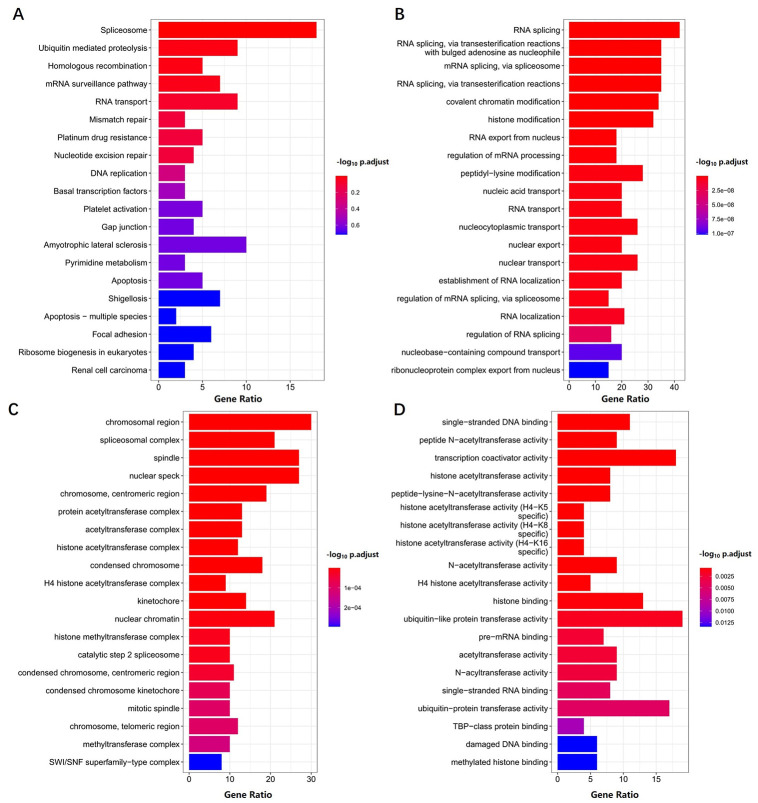
Fig 5. Functional enrichment analyses of differentially expressed genes (DEGs) in high- and low- UPF3B expression LIHC samples.
KEGG (A)and Gene Ontology (GO) analyses, including biological process (B), cellular component(C) and molecular function (D) were performed by clusterProfiler R package. Data was obtained via TCGA. P value < 0.05 was considered statistically significant.

