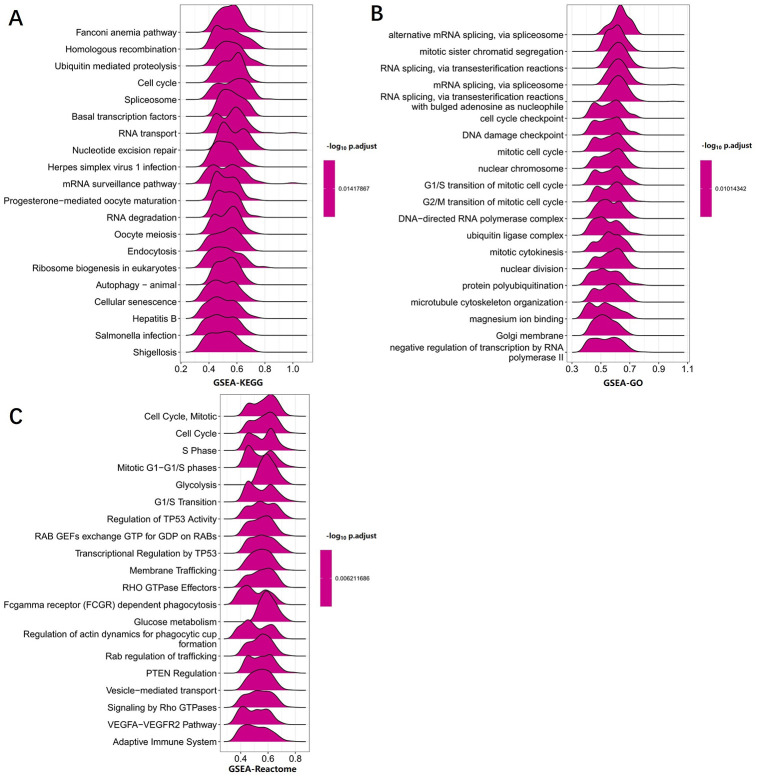
Fig 6. GSEA analysis revealed the pathway enriched in UPF3B high and low expression phenotype.
(A) GSEA analysis in KEGG gene sets. (B) GSEA analysis in GO gene sets. (C) GSEA analysis in ReactomE gene sets. Data was obtained via TCGA-LIHC. Only gene sets with NOM p < 0.05 and FDR q < 0.06 were considered significant.

