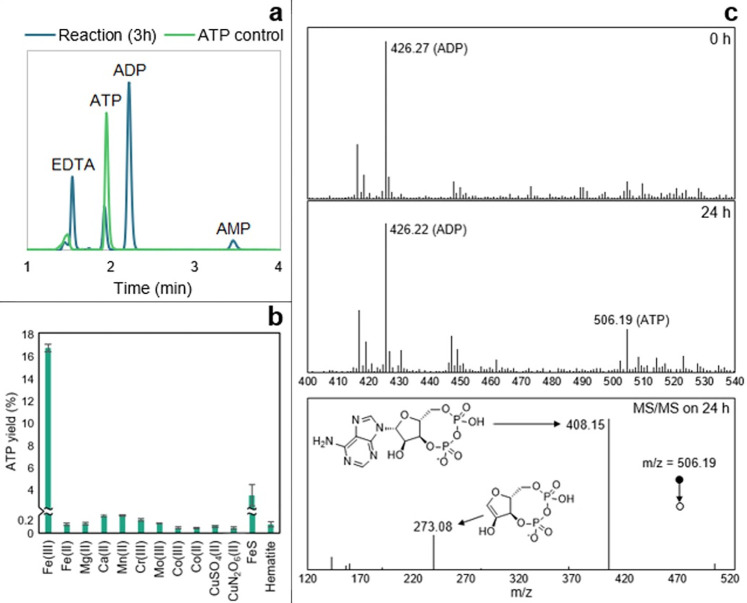
Fig 1. ATP synthesis with metal ion catalysts.
(a) HPLC trace of ATP control (0.7 mM) and ATP produced by the reaction ADP (1 mM) + AcP (4 mM) + Fe3+ (500 μM) at 30°C and pH approximately 5.5–6. (b) Test of reaction ADP (1 mM) + AcP (4 mM) at 30°C and pH approximately 5.5–6 with Fe3+ (Fe2(SO4)3), Mg2+ (MgCl2), Ca2+ (CaCl2), Mn2+ (Mn(NO3)2), Cr3+ (Cr(NO3)3), Mo3+ (MoCl3), Co3+ ([Co(NH₃)₆]Cl₃), Co2+ (CoCl2), CuSO4, Cu(NO3)2, FeS clusters (500 μM), and hematite (Fe₂O₃, 50 mg). The bars represent the ATP yield after 5 h. N = 3 ±SD. (c) Mass spectrometry analysis on a reaction sample at t = 0 h (upper panel) and 24 h (middle panel). The MS/MS spectrum and proposed structures of the products of the fragmentation of the ATP mass detected at 24 h (m/z = 506.19) is shown in the lower panel and was confronted to commercial standards and public data [137]. Conditions: ADP (1 mM) + AcP (4 mM) + Fe3+ (500 μM) at 30°C and pH approximately 5.5–6. The data underlying this figure can be found in Table A–C in S1 Data (sheet 1).

