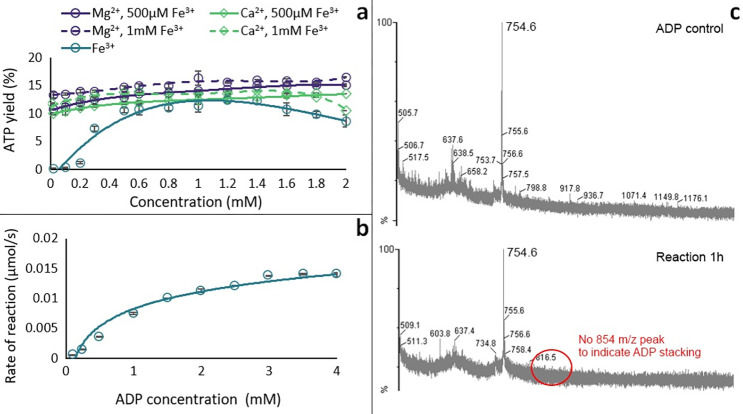
Fig 5. Mechanism studies.
(a) Effect of varying concentration of Fe3+ (teal circles) and adding increasing concentrations of Mg2+ (purple circles) and Ca2+ (green diamonds) on ATP yield at 2 h from the reaction ADP (1 mM) + AcP (4 mM) with 0.5 mM Fe3+ (solid line) and 1 mM Fe3+ (broken line) at 30°C and pH approximately 5.5–6. (N = 3 ±SD and 2 ±SD, respectively). (b) Michaelis–Menten kinetic analysis on the ADP + AcP reaction catalysed by Fe3+ (0.5 mM). N = 3 ±SD. (c) MALDI-ToF spectra of ADP control (top) and a reaction sample at 1 h (bottom). The data underlying this figure can be found in Table T and U and Fig A in S1 Data (sheet 5).

