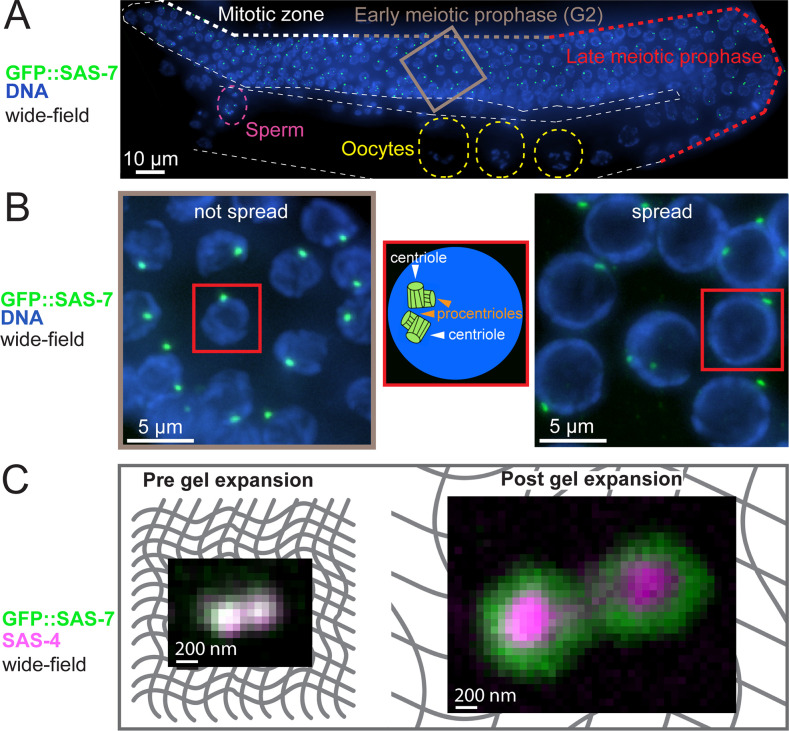
Fig 1. Combining gonad nuclei spreading and U-Ex microscopy to analyze worm gonad centrioles.
(A) Widefield imaging of ethanol-fixed worm expressing GFP::SAS-7. One layer of nuclei of the gonad is max intensity Z-projected (in this case, a height of 6.25 μm). White, grey, and red bold dashed lines indicate progression through the gonad from the mitotic zone to early and then late meiotic prophase; other white dashed line outlines the gonad. Grey box is magnified in (B). Yellow dashed regions mark 3 oocytes, purple dashed region the spermatheca. Note that centrioles are eliminated in oocytes, prior to fertilization. (B) (Left) Magnification of grey box region from (A). (Middle) Schematic representation of a single nucleus shown in the left and right panels. (Right) Early prophase region of a spread gonad from a worm expressing GFP::SAS-7. Note that spread nuclei are flattened and thus occupy a larger area compared to not spread nuclei. Note also that at this stage, centrioles do not act as microtubule organizing centers [55,56]. (C) Widefield imaging of centrioles in the early prophase region of the gonad from worms expressing GFP::SAS-7 before (left) and after (right) gel expansion. Grey mesh in the background represents the gel matrix.

