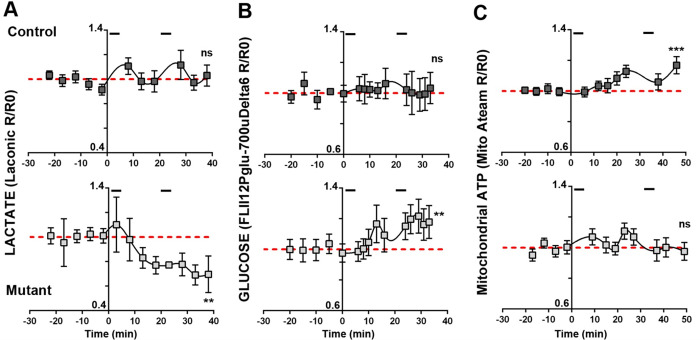
Fig 2. Mutant mice axons display an altered metabolic response to electrical stimulations.
The ratio of fluorescent probes (R) was normalized over the average ratio at time points before the first stimulation (R0)(basal value). Segments at the top of each Control mice graphs show stimulation periods. Lines show the basal value line. Statistical analysis shows the test for linear trend following one-way ANOVA analysis. Error bars represent SEM. A- n = 20 axons, 7 mice for Control and 7 axons, 4 mice for Mutant. B- n = 6 axons, 3 mice for Control and 9 axons, 3 mice for Mutant. C- n = 16 axons, 5 mice for Control and 14 axons, 5 mice for Mutant.

