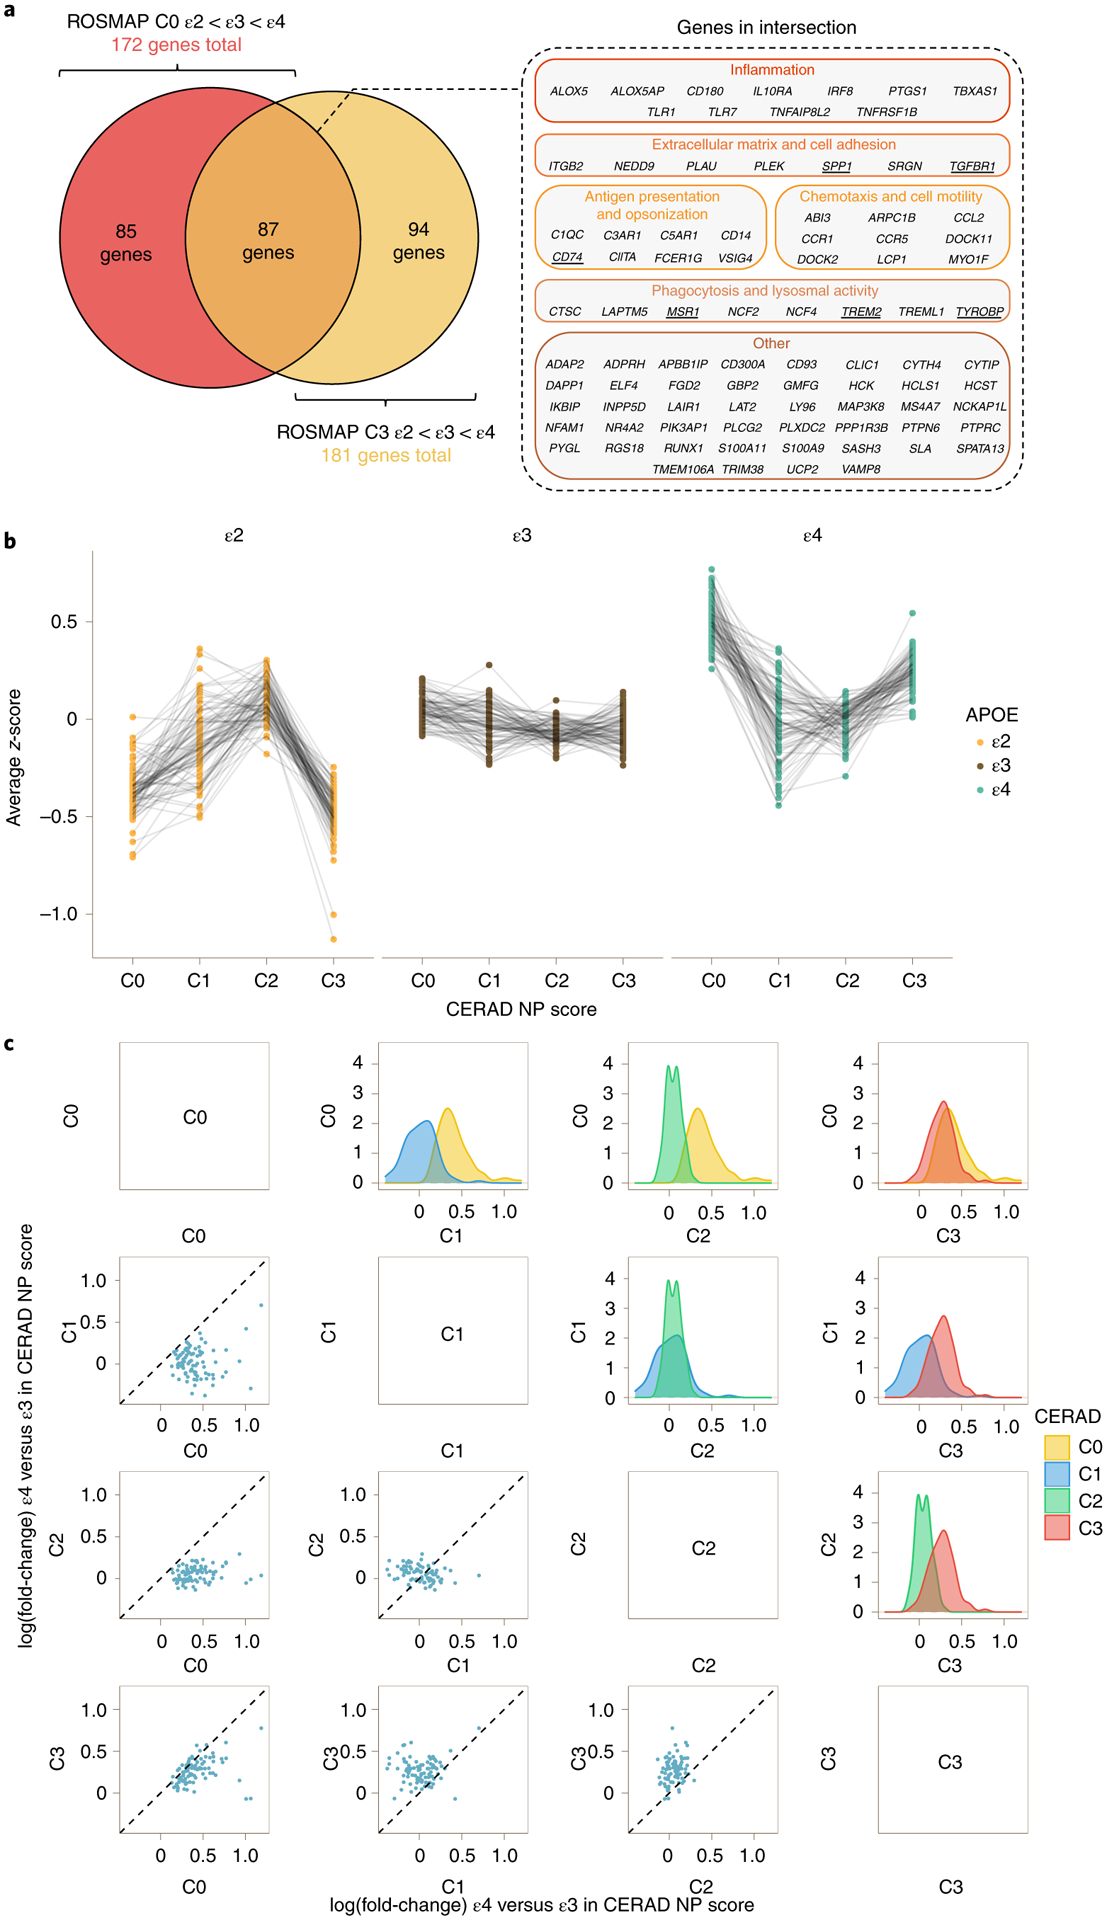
Fig. 3 |. The microglia-APOE signature is independent of known APOE effects on AD neuropathological changes.

a, Venn diagram (left) showing intersection between the 172 genes from the microglia-APOE cluster obtained by spectral clustering in ROSMAP C0 subjects and the 181 genes from C3 subjects. Note that the 87 DEGs in the intersection included relevant phagocytic and proinflammatory genes (right). The underlined genes were subsequently tested by RT–qPCR in APOE knock-in mice. b, Dot plots with connecting lines depicting group averaged expression-level z-scores of the 87 genes from a split by CERAD NP score and APOE genotype. Note that the most prominent changes across APOE genotypes correspond to C0 (no NPs) and C3 (frequent NPs) subjects. c, Correlation matrix comparing the APOEε4 versus APOEε3 change in expression levels (log(fold-change)) of the 87 DEGs from the microglia-APOE cluster of C0 and C3 subjects in the ROSMAP cohort. The scatter dot plots on the left and density plots on the right demonstrate that the largest differences between APOEε4 carriers and APOEε3 homozygotes are observed in C1 (sparse NPs) and C2 (moderate NPs) versus both C0 (no NPs) and C3 (frequent NPs) subjects. By contrast, APOEε4 versus APOEε3 differences in expression levels were attenuated between C1 (sparse NPs) and C2 (moderate NPs) subjects, and between C0 (no NPs) and C3 (frequent NPs) subjects, suggesting either higher heterogeneity in microglial activation state in intermediate stages (C1 and C2) masking APOE genotype effects, or two waves of activation of this microglial transcriptional program (in C0 and C3).
