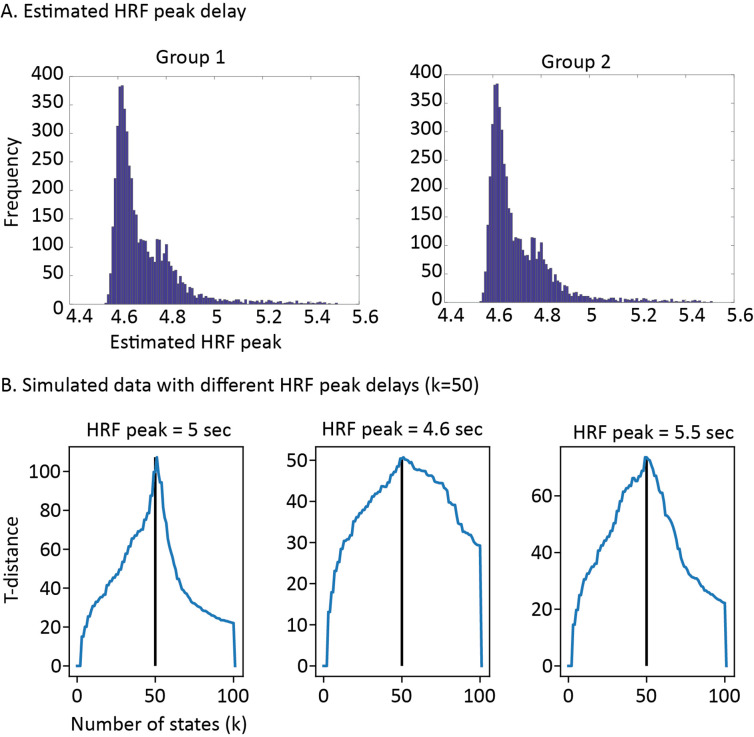
Appendix 1—figure 4. Estimated hemodynamic response function (HRF) peak delays and the impact of HRF peak delay on the estimated number of states in simulated data.
(A) The estimates of the HRF peak delays for all searchlights are shown in a histogram. The values are averaged across all participants within each of the independent groups. The distribution is highly similar for both groups. (B) t-distance curves are shown for simulated data with different HRF delays that are deconvolved with a canonical HRF. There is no systematic under- or overestimation of the number of states when the HRF peak delays are in the range of the empirical data.

