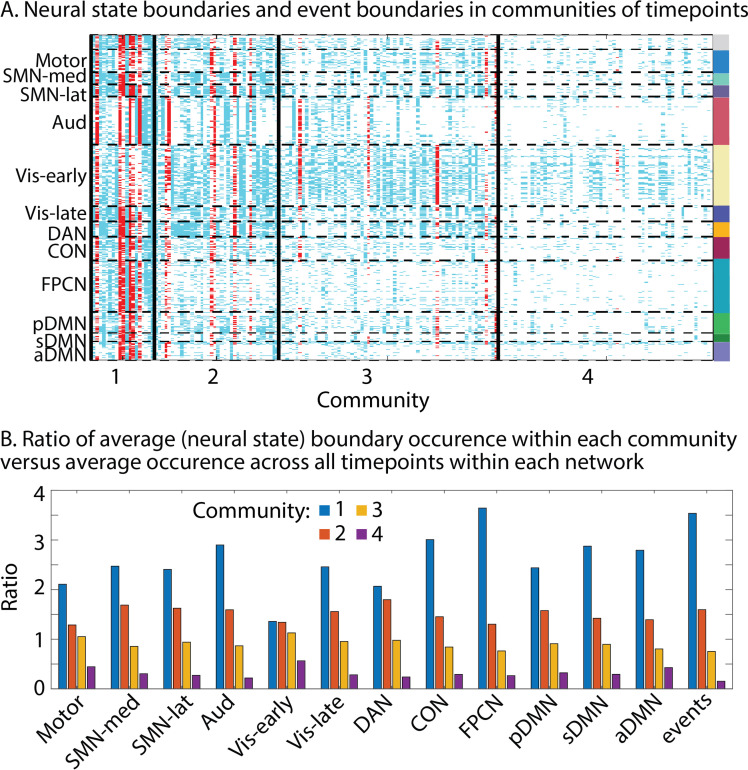
Figure 7. Communities of timepoints identified with weighted stochastic block model (WSBM).
This algorithm groups together timepoints that show similar boundary profiles (presence or absence of boundaries across searchlights). (A) Neural state boundaries are shown for each community per timepoint for each searchlight, grouped in functional networks. Boundaries shown in red coincide with an event boundary. (B) Per functional network, we show the ratio of the average state boundary occurrence within each community versus the average occurrence across all timepoints. The same is shown for the event boundaries. The data shown in this figure are based on data averaged across all participants.

