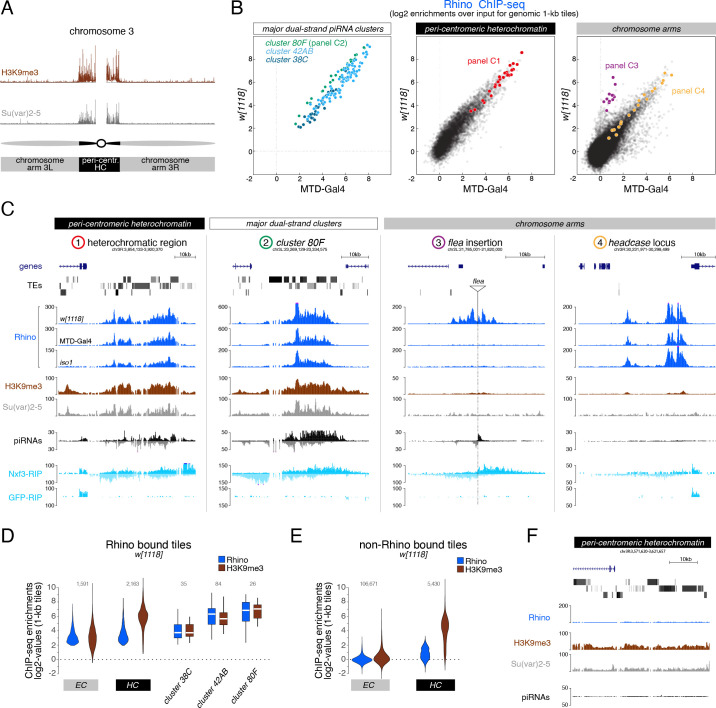
Figure 1. H3K9me3 is insufficient to define the large diversity of genomic Rhino domains.
(A) ChIP-seq enrichment (genome unique reads; 1-kb tiles, one representative replicate each) of H3K9me3 and Su(var)2–5 along the assembled chromosome 3 sequence in w1118 ovaries. Pericentromeric heterochromatin and euchromatic chromosome arms are indicated. (B) Scatter plot comparing average log2 ChIP-seq enrichments for Rhino in ovaries from w1118 (n=2) versus MTD-Gal4 >w-sh (n=3) strains (1-kb tiles separated into pericentromeric heterochromatin and chromosomal arms; piRNA clusters 38C, 42AB, and 80F are shown separately; colored 1-kb tiles correspond to example loci in panel C). (C) UCSC genome browser tracks depicting the diversity of Rhino domains. 1: heterochromatic, transposon-rich locus; 2: piRNA cluster 80F; 3: strain-specific flea insertion (ElMaghraby et al., 2019) in w1118; 4: Rhino domain proximal to euchromatic headcase locus. Unless indicated otherwise, data are from w1118ovaries (ChIP and RIP signal are depicted as coverage per million reads, piRNA coverage normalized to miRNA reads, data is displayed for one representative replicate). GFP-RIP-seq serves as control for non-specific mRNA binding. (D, E) Violin plots showing average log2 fold enrichment of Rhino ChIP-seq over input for 1-kb tiles (n=2) from w1118 ovaries. Tiles were grouped into Rhino-bound and non-Rhino-bound based on a cutoff of fourfold enrichment (corresponding to p=0.036, Z-score=2.1) of Rhino ChIP-seq signal over input in each replicate experiment. Rhino-dependent piRNA clusters 38C, 42AB, and 80F were analyzed separately (shown as box plots due to low number of tiles). Box plots show median (center line), with interquartile range (box) and whiskers indicate 1.5x interquartile range. (F) UCSC genome browser tracks depicting a pericentromeric heterochromatin locus marked by H3K9me3 and bound by Su(var)2–5, but not Rhino (ChIP-seq signal: coverage per million reads; piRNA coverage normalized to miRNA reads; all data obtained from w1118 ovaries, data is displayed for one representative replicate).


