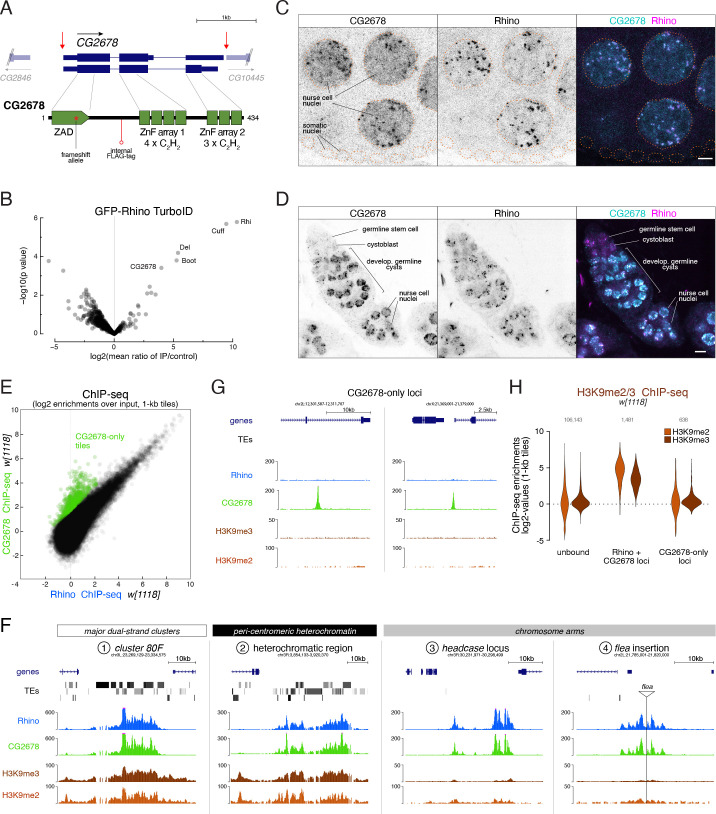
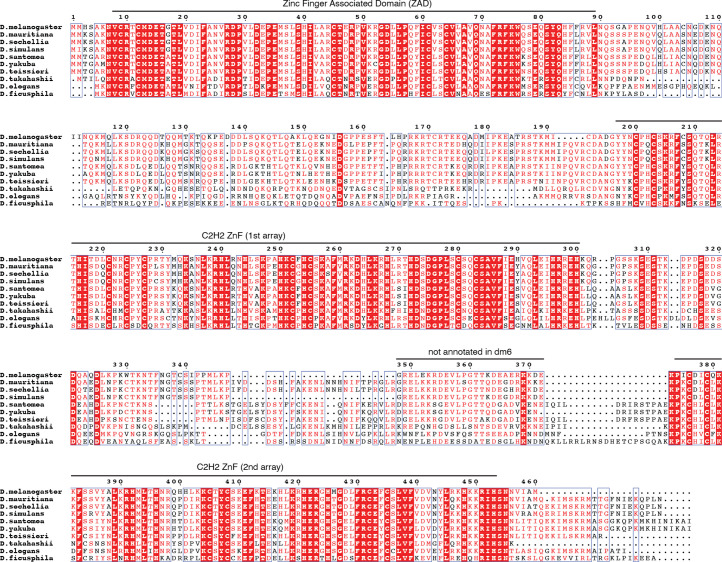
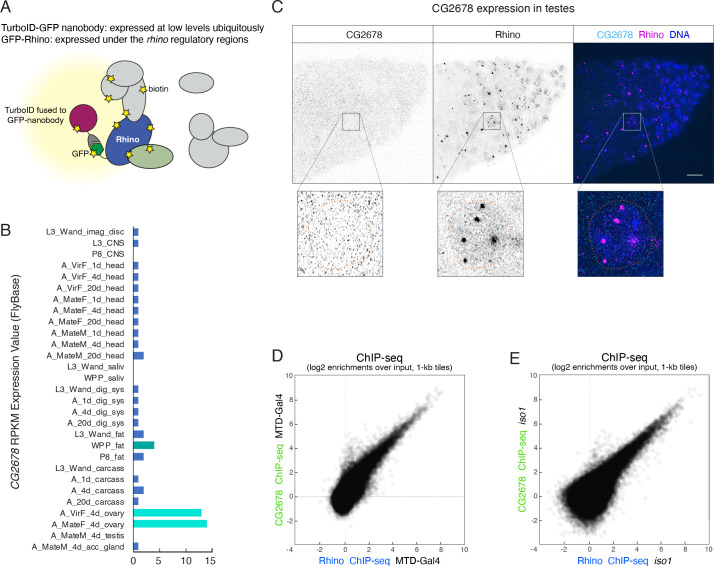
Figure 2. The ZAD-zinc finger CG2678 interacts with Rhino and binds Rhino domains genome-wide.
(A) Genomic CG2678 locus depicting the two annotated transcripts and CG2678 protein domain architecture (location of the frame shift mutation (red asterisk), internal 3xFLAG affinity tag (red circle), and cleavage sites for full locus deletion (red arrows) are indicated). (B) Volcano plot showing fold enrichment of proteins determined by quantitative mass spectrometry (Doblmann et al., 2019) in GFP-Rhino TurboID samples versus nuclear GFP TurboID control (n = 3 biological replicates; statistical significance based on two-sided t-test; P values corrected for multiple testing (Benjamini–Hochberg), see also Figure 2—figure supplement 2A and Figure 2—source data 1). (C, D) Confocal images of nurse cell nuclei (C) and germarium (D). Single channel and merged color images depict immunofluorescence signal for endogenous CG2678 (left, cyan) and Rhino (middle, magenta). Scale bar: 5 µm, dotted line: nuclear outline based on DAPI. (E) Scatter plot depicting correlation of log2-fold Rhino versus CG2678 ChIP-seq enrichment in w1118 ovaries (average of 2 replicates each). CG2678-only tiles are highlighted in green and were defined by significantly higher enrichment for Rhino than CG2678 (n=2, Z-score=3), plus a Rhino enrichment of max. 4-fold in two independent experimental replicates. (F, G) UCSC browser tracks illustrating CG2678 signal at diverse Rhino domains (F) and at CG2678-only peaks (G). ChIP-seq signal is shown as coverage per million sequenced reads for w1118 ovaries for one representative replicate. (H) Violin plots depicting log2-fold enrichment of H3K9me2 (orange, n=1) and H3K9me3 (brown, n=2) at euchromatic 1-kb tiles bound by neither Rhino nor CG2678, both proteins, or CG2678 only. Classification into groups was performed based on binary cutoffs for Rhino (fourfold) and a linear fit for CG2678 co-occupancy in two independent replicate ChIP-seq experiments from w1118 ovaries to extract CG2678-only tiles highlighted in (E).


