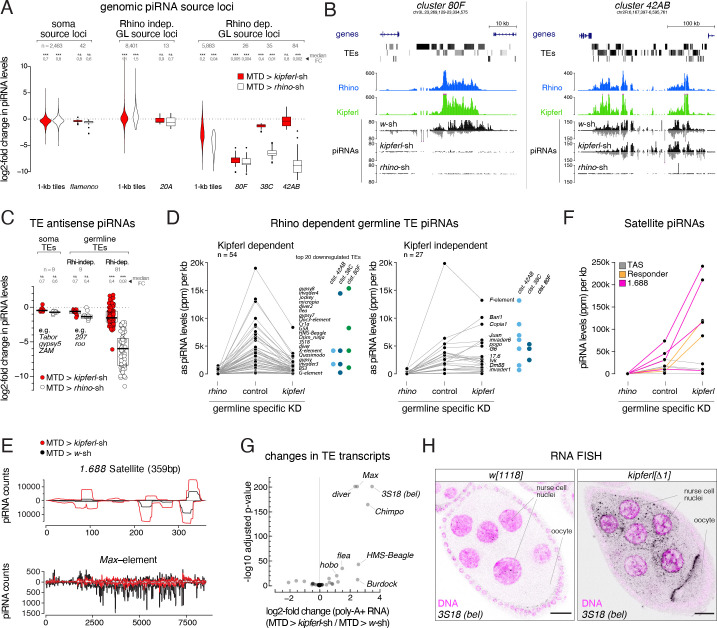
Figure 4. kipferl mutant ovaries display piRNA losses and transposon de-repression.
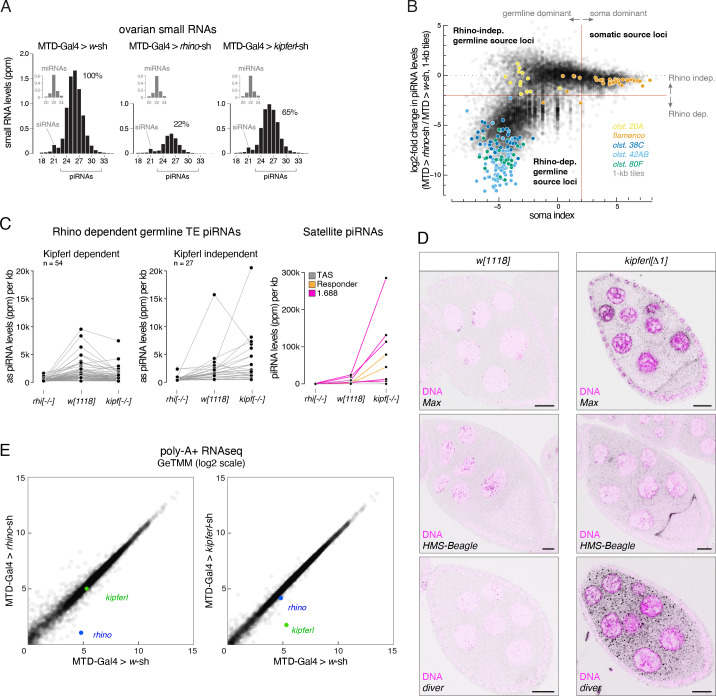
(A) Violin plots showing log2-fold changes in levels of uniquely mapping piRNAs on 1-kb tiles relative to control upon MTD-Gal4 mediated knock down of rhino or kipferl (1-kb tiles were categorized into somatic source loci, Rhino-independent germline source loci and Rhino-dependent germline source loci according to Figure 4—figure supplement 1B, n=1). *** and n.s. corresponds to p<0.001 or p>0.05, respectively, based on Wilcoxon signed-rank test. Box plots show median (center line), with interquartile range (box) and whiskers indicate 1.5x interquartile range. (B) UCSC genome browser tracks displaying piRNA levels at clusters 80F and 42AB in control, kipferl, and rhino knock down ovaries (ChIP-seq signal from MTD-Gal4 control ovaries is depicted as coverage per million reads, piRNA coverage was normalized to miRNA reads, data is given for one replicate). (C) Jitter plot depicting log2-fold changes for piRNA levels mapping antisense to transposon consensus sequences in indicated MTD-Gal4 mediated knock downs compared to control (transposons classified analogous to panel A, n=1). *** and n.s. corresponds to p<0.001 or p>0.05, respectively, based on Wilcoxon signed-rank test. (D, E) Jitter plots showing piRNA levels (per kb sequence) in indicated genotypes mapping to transposons (antisense only) giving rise to Rhino-dependent piRNAs (D) or to Satellite repeats (E). Blue and green dots in panel D indicate fragments of the respective transposon in piRNA clusters 38C, 42AB, or 80F (n=1, compare to Figure 4—figure supplement 1C for full mutant data, and see Figure 4—source data 1). (F) piRNA profiles across the consensus sequences for a representative transposon (Max) and the 359bp 1.688 Satellite. piRNA counts (normalized to miRNAs) are displayed for indicated genotypes. (G) Volcano plot depicting the log2-fold changes in poly-adenylated transposon transcripts in kipferl-depleted versus control ovaries (n=3). (H) Confocal images showing RNA FISH signal for 3S18 transcripts in w1118 and kipferl null mutant ovaries (scale bar: 20 µm).


