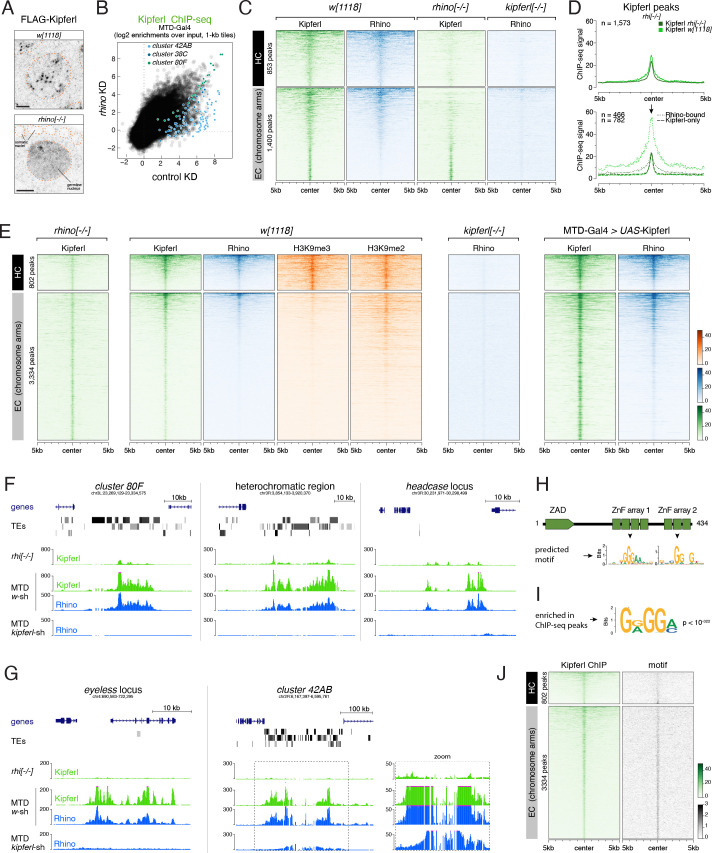
Figure 5. Kipferl binds guanosine-rich DNA motifs and nucleates Rhino domains within H3K9me2/3 loci.
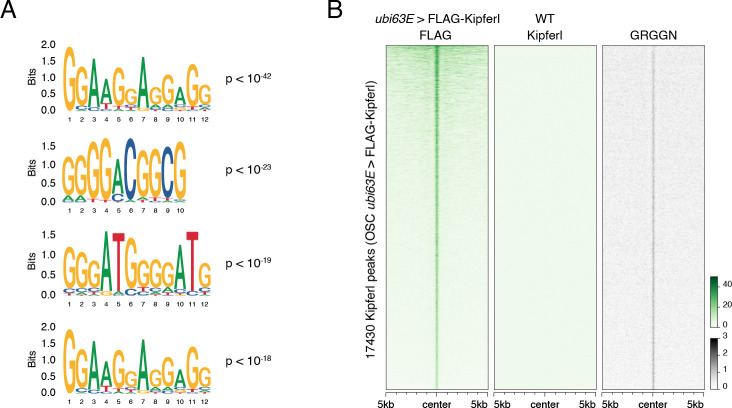
(A) Confocal images of nurse cell nuclei expressing FLAG-tagged Kipferl in indicated genetic backgrounds (scale bar: 5 µm; nuclear outlines based on DAPI as orange dotted line). (B) Scatter plot of genomic 1-kb tiles contrasting average log2-fold Kipferl ChIP-seq enrichment in ovaries with MTD-Gal4 driven rhino knock down (n=2) versus control ovaries (n=3). (C) Heat maps depicting ChIP-seq signal for Kipferl and Rhino in indicated genotypes from representative replicate experiments, centered on broad Kipferl peaks detected in two independent ChIP-seq experiments of w1118 ovaries (data sorted by Kipferl signal in w1118). (D) Meta profile showing Kipferl signal in wildtype and rhino mutant ovaries at all narrow Kipferl peaks determined in rhino mutant ovaries (top). The same peaks are divided into Rhino-Kipferl co-occupied (dotted line) and Kipferl-only peaks (dashed line) based on intersection with wildtype Rhino domains (bottom). (E) Heat maps depicting indicated ChIP-seq signal in indicated genotypes from representative replicate experiments centered on narrow Kipferl peaks detected in two independent ChIP-seq experiments of rhino mutant ovaries (data sorted by Rhino signal in w1118). (F, G) UCSC genome browser tracks depicting Kipferl and Rhino ChIP-seq signals in indicated genotypes for diverse Rhino domains with (F) or without (G) pronounced Kipferl nucleation sites. Zoomed in view of cluster 42AB is given to appreciate small Kipferl enrichments in the peripheral part of the cluster (ChIP-seq signal depicted as coverage per million reads; piRNA coverage normalized to miRNA reads, data is given for one representative replicate). (H) Schematic representation of Kipferl protein domain architecture and binding motifs predicted for the two ZnF arrays (Princeton Cys2His2 PWM predictor). (I) Position weight matrix of Kipferl consensus motif determined by HOMER from top 3000 narrow Kipferl peaks found in two independent ChIP-seq replicates from rhino mutant ovaries. The GRGGN motif was found at least once in 83.4% of peaks versus 50.3% in control sequences (P<10–322). (J) Heat map depicting Rhino-independent Kipferl ChIP-seq signal and GRGGN motif enrichment centered on narrow Kipferl peaks analogous to panel E, sorted by Kipferl signal in rhi[-/-] (motif count: # of motifs per non-overlapping genomic 100-bp window).


