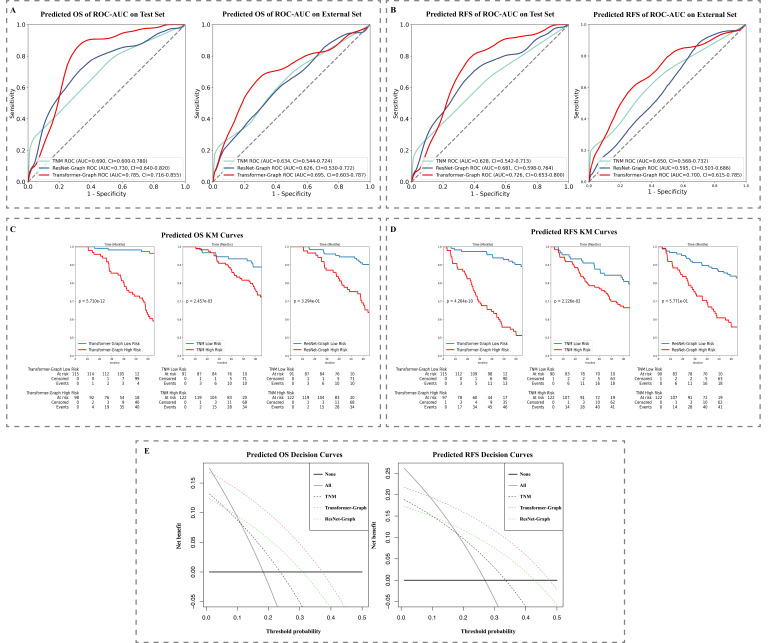
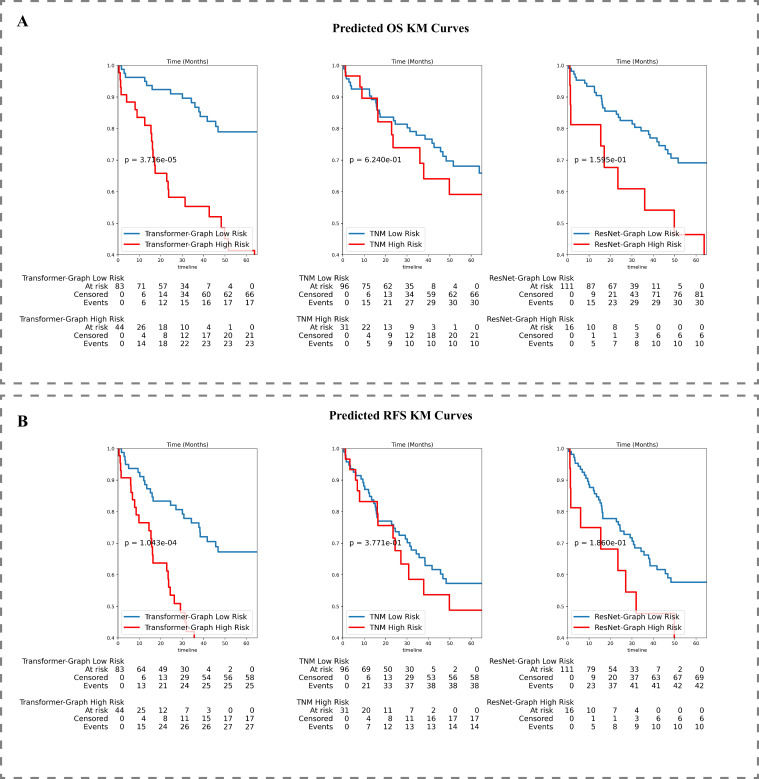
Figure 4. Model performance: (A) ROC-AUC curve on test data and external set for OS and (B) RFS prediction and (C) KM curve on test data set for OS and (D) RFS prediction.
(E) Decision curve on test data set for OS and RFS prediction. KM, Kaplan–Meier; OS, overall survival; RFS, recurrence-free survival; ROC-AUC, area under the receiver operator characteristic curve.


