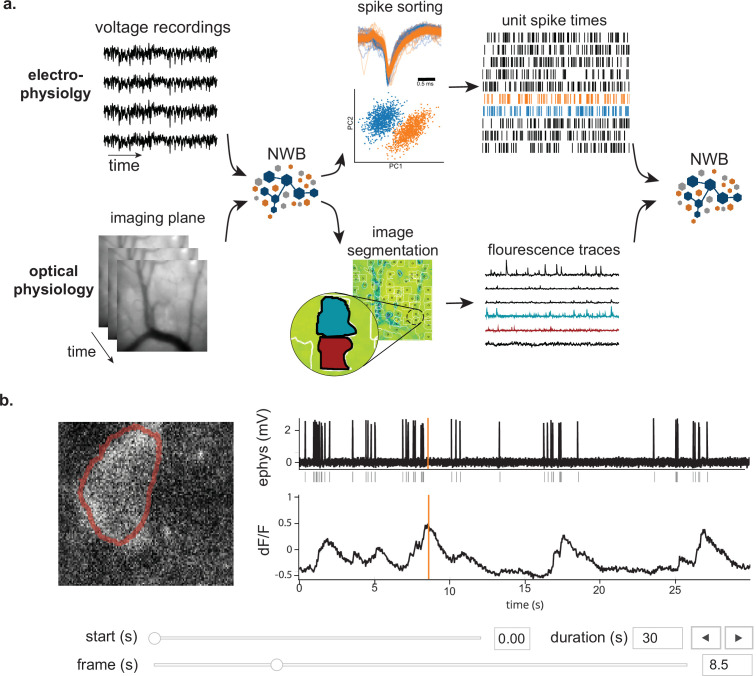
Figure 2. NWB enables unified description and storage of multimodal raw and processed data.
(a) Example pipelines for extracellular electrophysiology and optical physiology demonstrate how NWB facilitates data processing. For extracellular electrophysiology (top), raw acquired data is written to the NWB file. The NWB ecosystem provides interfaces to a variety of spike sorters that extract unit spike times from the raw electrophysiology data. The spike sorting results are then stored into the same NWB file (bottom). Separate experimental data acquired from an optical technique is converted and written to the NWB file. Several modern software tools can then be used to process and segment this data, identifying regions that correspond to individual neurons, and outputting the fluorescence trace of each putative neuron. The fluorescence traces are written to the same NWB file. NWB handles the time alignment of multiple modalities, and can store multiple modalities simultaneously, as shown here. The NWB file also contains essential metadata about the experimental preparation. (b) NWBWidgets provides visualizations for the data within NWB files with interactive views of the data across temporally aligned data types. Here, we show an example dashboard for simultaneously recorded electrophysiology and imaging data. This interactive dashboard shows on the left the acquired image and the outline of a segmented neuron (red) and on the right a juxtaposition of extracellular electrophysiology, extracted spike times, and simultaneous fluorescence for the segmented region. The orange line on the ephys and dF/F plots indicate the frame that is shown to the left. The controls shown at the bottom allow a user to change the window of view and the frame of reference within that window.

