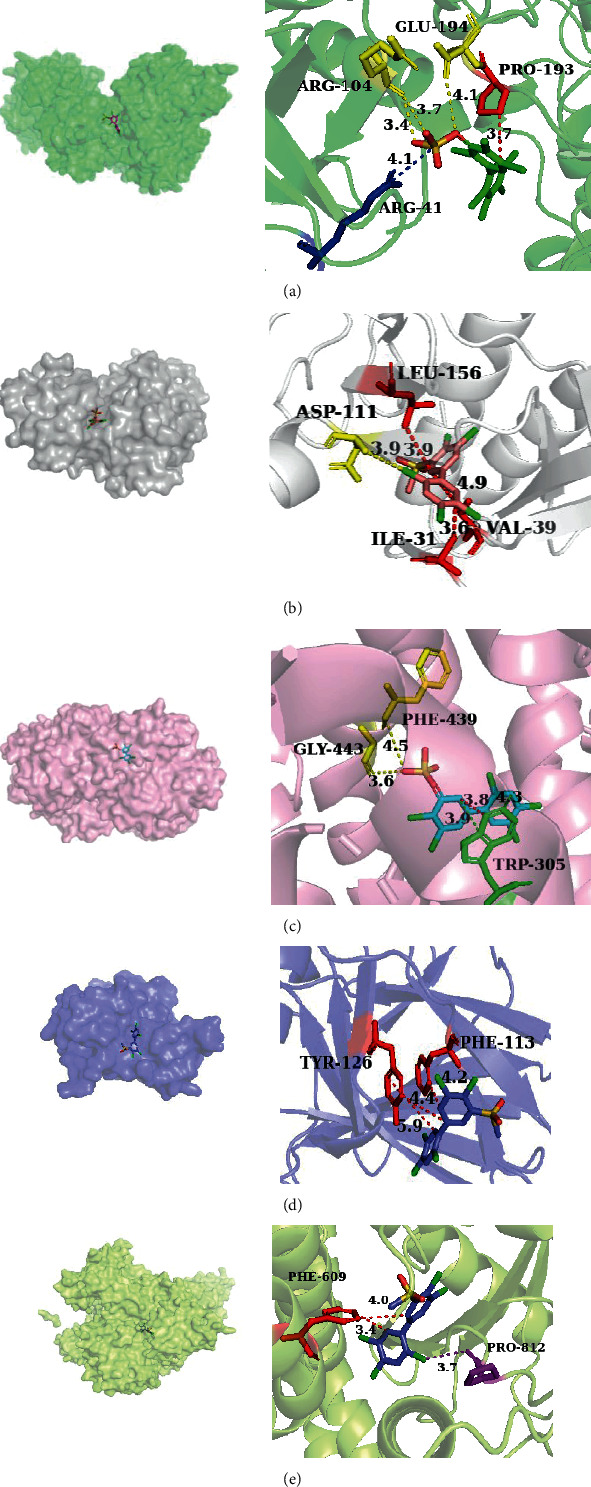
Figure 10.

The 3D visual analysis results of molecular docking of PCBs metabolite with key target proteins. The 3D visual analysis results of molecular docking were using PyMOL software (https://http://pymol.org/2/), PLIP database (https://projects.biotec.tu-dresden.de/plip-web/plip/index), and AutoDock Vina software (http://vina.scripps.edu/) (yellow dotted line: hydrogen bond; red dotted line: hydrophobic interaction; green dotted line: Π-stacking; purple dotted line: halogen bonds; blue dotted line: salt bridges. (a) 6GES and 3'-sulfate-PCB-180, (b) 6SLG and 3-MeSO2-PCB-118, (c) 7JIS and 3-MeSO2-PCB-118, (d) 5G4N and 3-MeSO2-PCB-118, (e) 6JNO and 3-sulfate-PCB-118; 3D: three-dimensional).
