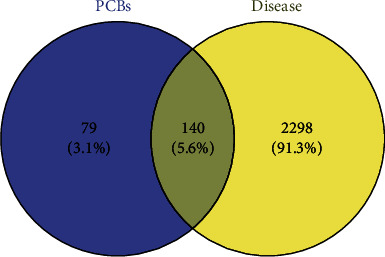
Figure 2.

Venn diagram of PCBs and thyroid hormone dysfunction targets. The diagram was built using Venny 2.1 online tool (http://bioinfogp.cnb.csic.es/tools/venny/) according to the data from the STRING database.

Venn diagram of PCBs and thyroid hormone dysfunction targets. The diagram was built using Venny 2.1 online tool (http://bioinfogp.cnb.csic.es/tools/venny/) according to the data from the STRING database.