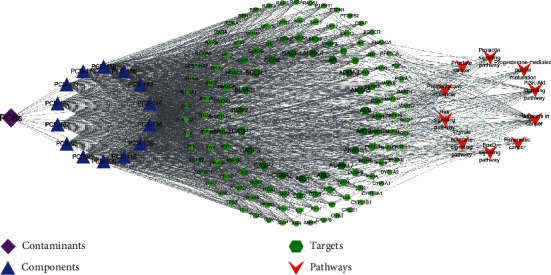
Figure 6.

“Components-targets-pathways” network diagram. The network diagram was built using Cytoscape software 3.6.1. (https://cytoscape.org/). (The purple box represents PCBs pollutants, the blue box represents the chemical components of PCBs pollutants related to thyroid dyscalculia, the green box represents intersection targets, and the red box represents key pathways. Grey lines represent interactions).
