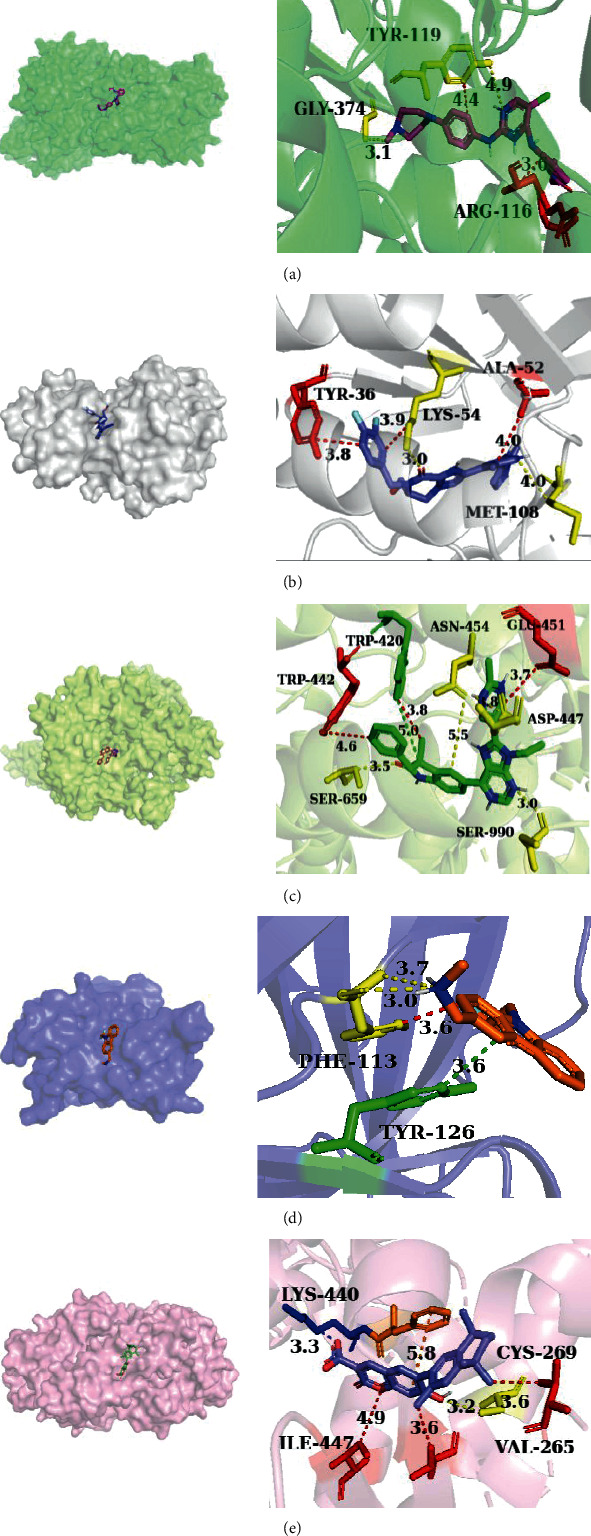
Figure 9.

The 3D view of the molecular docking pattern of each protein with its ligand. The 3D pattern of target interaction was marked by PyMOL software (https://pymol.org/2/), PLIP database (https://projects.biotec.tu-dresden.de/plip-web/plip/index), and AutoDock Vina software (https://vina.scripps.edu/) (yellow dotted line: hydrogen bond; red dotted line: hydrophobic interaction; green dotted line: Π-stacking; purple dotted line: halogen bonds; blue dotted line: salt bridges. (a) 6GES, (b) 6SLG, (c) 7JIS, (d) 5G4N, (e) 6JNO; 3D: 3-dimensional).
