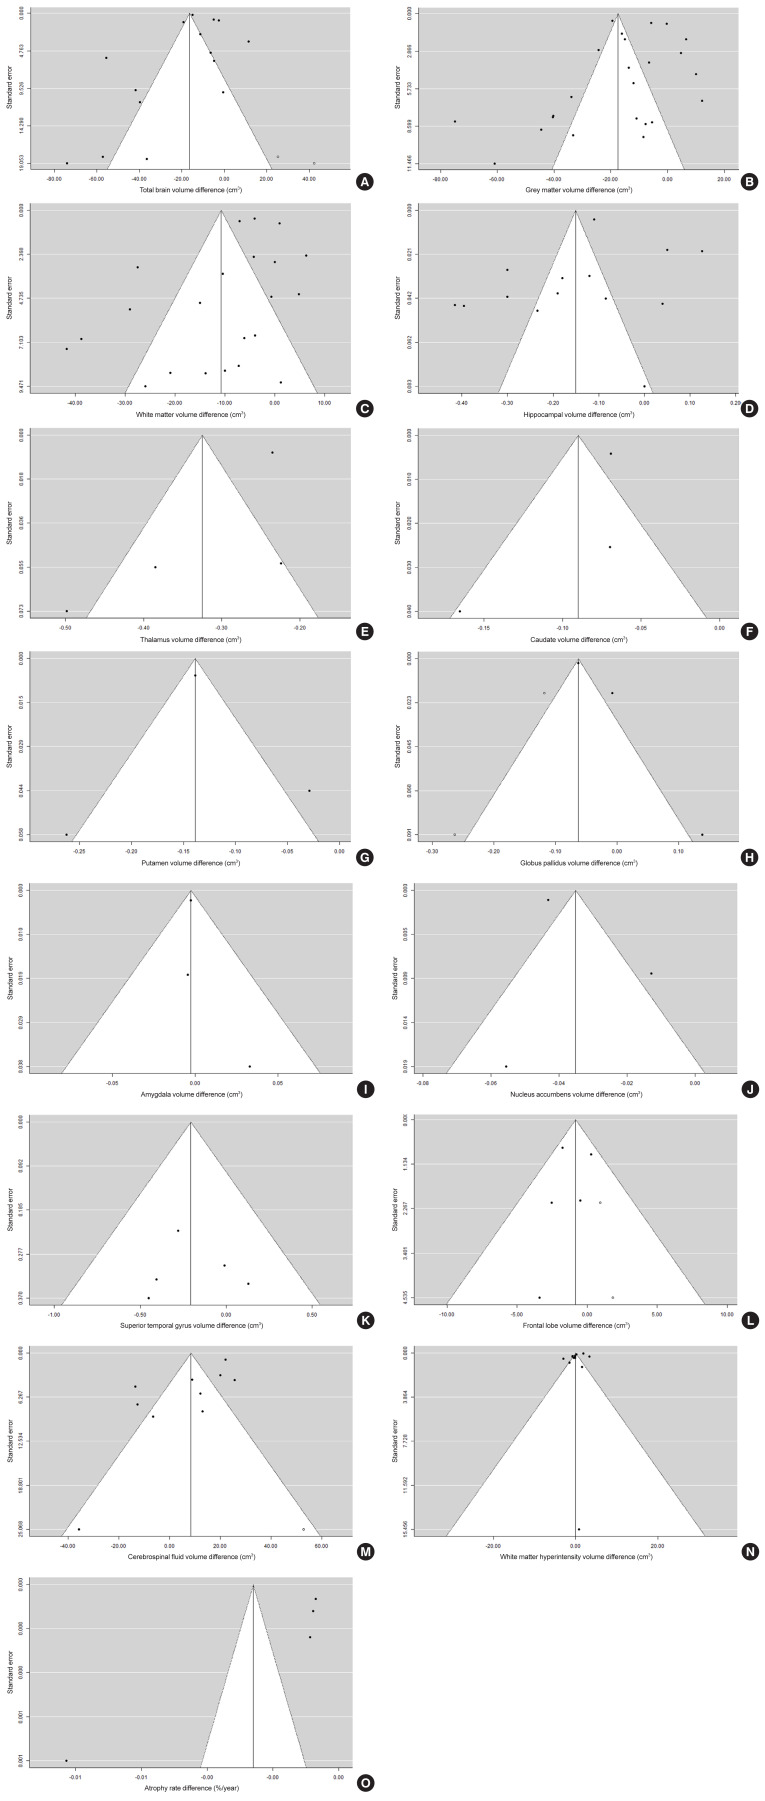
Fig. 3.
Funnel plots of brain volumes and atrophy rate assessing possible publication bias using the trim and fill method. Filled circles represent studies included in the meta-analysis. Open circles represent possible missing studies. Brain volumes: (A) total brain volume, (B) grey matter, (C) white matter, (D) hippocampus, (E) thalamus, (F) caudate, (G) putamen, (H) globus pallidus, (I) amygdala, (J) nucleus accumbens, (K) superior temporal gyrus, (L) frontal lobe, (M) cerebrospinal fluid, (N) white matter hyperintensity, and (O) total brain atrophy rate._(Continued to the next page)

